
Don’t get the butterflies: using a climate outlook is simple
04 September 2014
Wouldn’t life be easy if we could tell how the weather would turn out in three, four or even more weeks’ time? It may sound like the realm of science fiction, but the Bureau’s climate outlooks are taking some big steps forward. Learning how to use them is the key.
We all find the seven-day forecast useful when planning our week’s activities, work events, holidays and travel. But spare a thought for the farmer who has to look far into the future to decide on their best mix of crops, or the retailer trying to settle on the right date to switch between their winter and summer collections.
For thousands of Australians in weather-sensitive businesses, such decisions can spell the difference between a good year and a bad one.
Fortunately, the Bureau of Meteorology is providing an increasingly detailed array of climate outlooks, which apply some of the world’s most sophisticated atmospheric and ocean modelling to assess how Australia’s rainfall and temperatures may evolve over the next three months.
Dealing in probabilities
Seasonal climate outlooks are not weather forecasts. Rather than say it will be warm and dry, seasonal outlooks say it is likely to be warm and dry.
There’s a big difference. In statistical speak, the seasonal outlooks are ‘probabilistic’ rather than ‘deterministic’—which basically means they look at the odds, or the chance, of an event occurring.
Why? Well, it’s all because of butterflies…
Unlike weather forecasts, purely random changes in the atmosphere and ocean mean it will never be possible to make a perfect prediction for how the weather will turn out on a particular day in three months’ time.
If something causes a small change in pressure or temperature, for example, this little wobble has the potential to amplify and cause significant physical changes downstream. Mathematicians call this the ‘Butterfly Effect’—the theory that a butterfly flapping its wings in the Amazon could ultimately create a tropical cyclone off Queensland.
In modelling our seasonal outlooks, we expect that about 30 per cent of the time there will be a non-climate factor (our butterflies) coming into play. But the rest of the time, averaged out to about 70 per cent across Australia, the outlooks will be largely predictable.
A long history
The Bureau’s climate outlooks have come a long way since the first two-month outlook was issued 25 years ago. The evolution of the Bureau’s seasonal outlooks will be explored in a second article in September, but perhaps the greatest change occurred last year, when the statistical model on which the outlooks were based was replaced by a ‘dynamical’ model called POAMA (Predictive Ocean Atmosphere Model for Australia), which models physical changes in the Earth’s atmosphere, oceans, ice and land.
POAMA’s multi-layered forecasting capabilities have been shown to increase the accuracy of rainfall and temperature outlooks in many parts of Australia. In 2011, a study on simulated wheat crops in southwest Western Australia suggested that significant revenue increases could be achieved by applying nitrogen fertilisers according to a ‘moderately skilful’ rainfall forecast by POAMA. Today, 20 farmers around the country have joined a program called Climate Champions, and are using the Bureau’s seasonal outlooks and El Niño tracker to support their long-term cropping and livestock decisions.
Retailers have also approached the Bureau to see if our seasonal outlooks can help them with their strategic planning. Recent news of the negative impacts of mild temperatures on winter clothing stocks suggest that our seasonal climate tools may hold significant potential for such retailers.
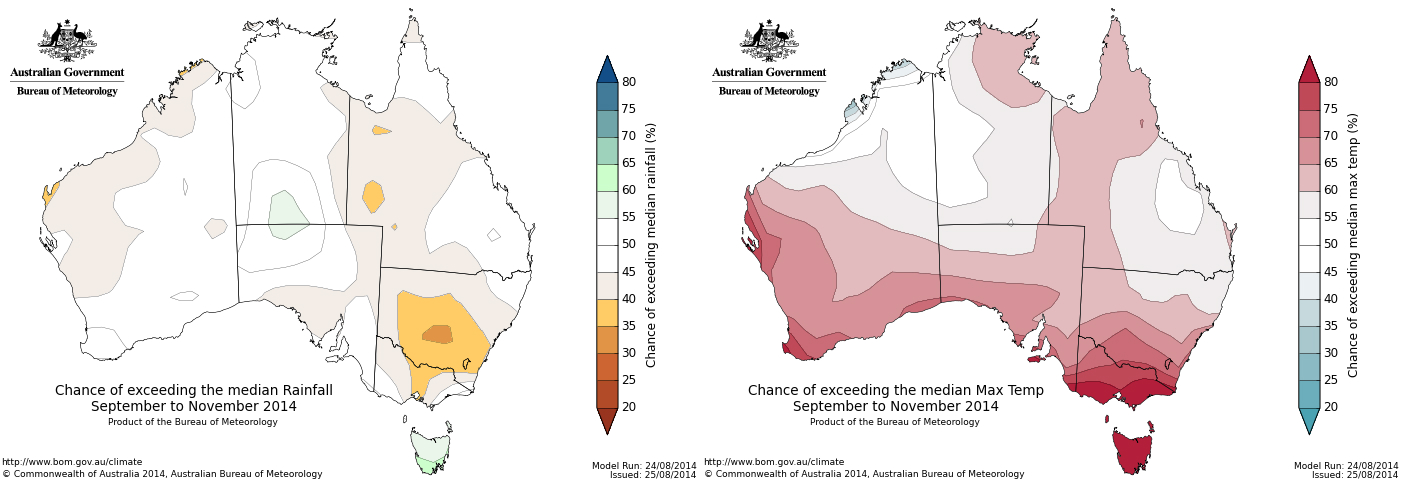
Climate maps showing the chance of exceeding median rainfall (left) and median maximum temperature (right) from the September to November 2014 climate outlook
How? Well, take the outlooks for Sydney and Melbourne in the earlier part of this year. Much of the long-term temperature outlooks were for warmer than average days. Retailers potentially could have used this information to phase in their winter coats a few weeks later, or to wait a little longer before putting their air conditioners on sale.
Of course, climate-related decisions are far more complex than this, and must take into account a huge range of other factors—but potentially, if these other factors were not insurmountable, they could have hedged some of their weather-exposed stock towards a warm start to winter. If the year turned out to be a lot warmer than average, they wouldn’t have been affected as much. And if they did this consistently over time, they would win out more than they would lose.
The same goes for small scale operations. Given a 60 per cent chance of favourable rainfall and temperatures, a farmer has a number of choices. If the deep soils are damp and the bank balance is fine, they may hedge towards applying more nitrogen and possibly planting a riskier (but potentially more profitable) crop. But if things have been dry, the price of diesel is heading up, the kitchen needs a reno, and the bank manager is getting grumpy, then the 40 per cent risk of dry may mean they stick to a more conservative cropping routine this season.
Using the odds to guide decisions is exactly what risk managers the world over do every day. For instance, how many failing casinos do you see? That’s because they don’t rely upon single big wins (unlike most punters), but rather on having the odds often only marginally in their favour, and going in for the long haul. It’s why there are just one or two slots that aren’t red or black on a roulette wheel. It only gives the house a few percentage points advantage, but that’s all they need.
It’s similar hedging with climate model odds. While you’re far from guaranteed a big win every season, because there is always that element of chance (our friends the butterflies), you know that in the long run, having the odds in your favour will mean you’ll come out on top.
Comment. Tell us what you think of this article.
Share. Tell others.