
Yarning about the weather
08 March 2017
Tess Davies loves to chat about Melbourne's temperamental weather—in fact, she's so passionate about it, she crocheted a large blanket documenting the city's daily temperatures for the whole of 2016.
Tess' beautiful blanket celebrates the changeable face of Melbourne's weather: each coloured row represents Melbourne's maximum temperature on one day.

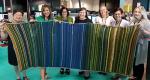
Image: Tess Davies (centre) and staff at the Bureau's Victoria Regional Forecasting Centre in Melbourne.
'Nerd-knitting' is how Tess, an IT Manager, describes her crocheted visualisation of weather data. 'Before creating the blanket, I had to forecast how much yarn I would need and how many colours I'd need … I looked back over 50 years of data from the Bureau'. Tess analysed the data to find how many 5 °C increments Melbourne swings through over an average year, and added one standard deviation for safety. She selected eight colours of yarn from Bendigo Woollen Mills, ranging from a purple for 5–10 °C to bright red for 40–45°C.
The finished blanket has 366 coloured rows (2016 was a leap year) and 11 grey rows to mark the boundaries between months. Each month also has a coloured border, at the edge of the blanket, representing Melbourne's climatological average maximum temperature (based on 30 years of data), so you can see at a glance how many days were warmer or cooler than average for the time of year.
You can explore the data from Melbourne's Olympic Park observations site yourself.
In the first two weeks of 2016, Melbourne's weather changed so rapidly that Tess had already used most of the colours. That included the only red row in the blanket, for the one day Melbourne climbed above 40 °C (13 January). Despite the long and cold winter, shown as the blocks of deep blue, Tess didn't get to use her purple yarn as Melbourne didn't have a day with the maximum temperature under 10 °C. Two unusually hot days stand out in November (19 and 20), followed by one much cooler day (21), which marked Victoria's thunderstorm asthma event.
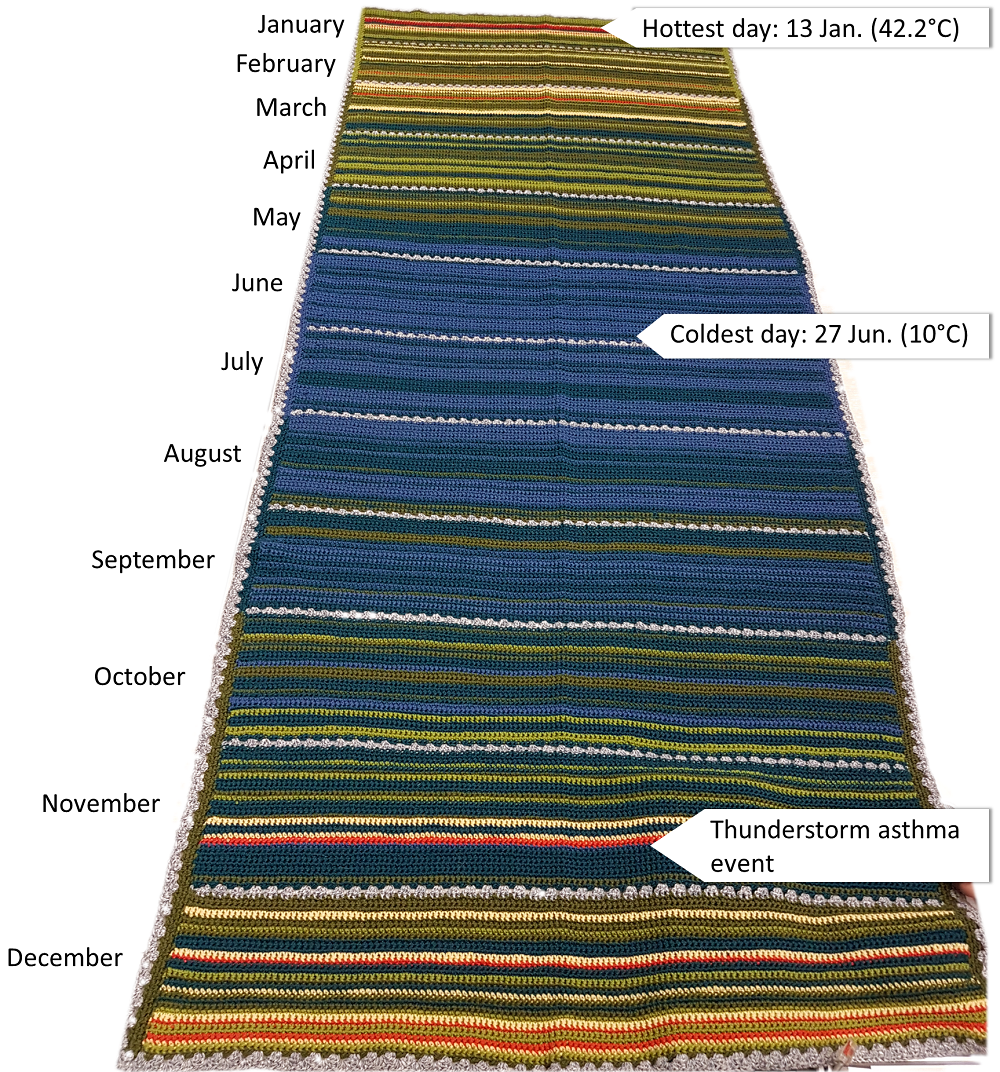
Image: Tess' blanket, annotated with months and notable dates.
As well as individual days, you can make out patterns over time: 'It's interesting how the weather changes temperature so much during summer, but winter's quite stable,' says Tess, 'and I think that surprised people'.
On 8 March 2017, International Women's Day, Tess shared her colourful creation with Bureau meteorologists and other staff at our Melbourne office. 'I'm super excited to show weather experts my knitted representation of Melbourne's weather over a year,' she told Bureau staff. 'It was a lot of work, but absolutely worth it'. Tess estimates each row took about 10–12 minutes to knit, so the whole blanket represents about 70 hours work.
So what's the next project Tess wants to wrap herself up in? 'I'd like to go back over the Bureau climate data in the year my daughter was born and knit a blanket which represents the temperature each day in the first year of her life … that'd be cool'. We couldn't agree more.
Comment. Tell us what you think of this article.
Share. Tell others.