
Chalk, Cheese, Cats and Dogs - what can we say about La Nina in 2011?
29 September 2011
Dr. Andrew Watkins, Climate Prediction Services
When it comes to climate, and making long-range forecasts, it's all about the drivers.
"What in the wide, wide world of meteorology is a driver?" I hear you cry.
Well, a driver is something that pushes the weather towards one average state or another. A good example is the sun and the seasons. The seasons don't just happen because they feel like a bit of a change every few months, they happen because the sun tracks overhead from one hemisphere to the other. As it does it 'drives' the climate from mild to cool to mild to warm and back to mild again.
Sure, there are heatwaves and cold snaps and everything in between (i.e. that pesky annoying atmospheric chaos some non-climatologists refer to as 'weather'), but we all feel it as the seasons pass and that, my friend, is climate. And the sun is the driver.
There are plenty of other drivers on our climate that can push local conditions away from what you'd normally expect. For Australia, and indeed large parts of the globe, the chief cook and bottle-washer is called the El Niño-Southern Oscillation or ENSO. ENSO describes the warming and cooling of the tropical Pacific Ocean, which typically takes place on scales of about two to seven years. When the central Pacific is cooler than normal, we have La Niña. When it's fairly normal we are in a neutral state. And when it's warmer than normal we have an El Niño. Here we'll let you in on a little secret. Climatologists hate talking about El Niños and La Niñas. Why? Well as soon as you mention El Niño many people think drought. And after 2010-11, many people think La Niña means flood.
Ay-Carumba!
ENSO is actually a continuum, which is just a fancy way of saying it varies fairly smoothly, slowly shifting from one end of the scale to the other. Both ENSO and its impacts don't act like flicking a switch: rather Australia tends towards drier/warmer conditions as ENSO gets 'warmer' (more like El Niño) and wetter/cooler conditions as ENSO goes 'cooler' (more like La Niña). And it doesn't always reach the same levels of warm or cool, and even when it does, there are no guarantees that the impacts will be the same. In fact that's about the only thing we can be certain about: impacts WON'T be the same every time at every location.
So what does this mean for those terms La Niña and El Niño? Just that La Niña does not equal flood - it means the odds of good or heavy rain increase. Likewise El Niño doesn't mean drought - it just lifts the chance. Put it this way, we've had around 18 La Niñas since 1900, yet only about three have been as significant as the 2010-11 event.
"So what about 2011-12? Word on the street is that we might have another La Niña?" I hear you say.
Well that's true. There is an increased chance of La Niña. But the real $64 million question is - how do things stack up against last year? And more to the point, are the odds as high for a big wet?
Well, first of all, let's look at last year. And let's narrow it down to this week last year.
This week last year the central Pacific Ocean (which is what every climatologist and their ocean array looks at) was about 1.4°C cooler than normal. That's a lot! So what has the temperature been this week (i.e. right now). Drum roll please ... about 0.6°C cooler than normal or 0.8°C warmer than last year.
To put the -1.4°C (this week last year) and the -0.6°C (this week) into context, in the tropical Pacific during September about 70 per cent of the time the water is within 0.9°C of its normal temperature (23.7°C). In other words, last year was "WOW!!!" and this year is "Well, that's kinda interesting, I might keep an eye on that..."
Of course the oceans aren't everything (sorry oceanographers, but that's true!). The atmosphere can also tells us how well ENSO is bubbling along. There are lots of ways of looking at the atmospheric part of ENSO, but the most common in Australia is to look at the Southern Oscillation Index, lovingly referred to by both farmers and climate scientists alike as 'The SOI'. When the SOI is positive, it means there is relatively higher pressure over Tahiti than there is over Darwin, and when it's negative it's the opposite. Huh?
Well, all that means is that the region more favourable for rain shifts from Australia and out into the Pacific when the SOI is negative (i.e. El Niño) and shifts more over Australia when its positive (La Niña). About 70 per cent of the time, the SOI lies between +10 and -10. So what was the SOI this time last year? A whopping great +24.7! In climate terms, that's gangbusters. And right now? A respectable, and arguably 'worth writing home to mum about' +8.9.
But, dare I say, ENSO isn't everything. Two other major factors that influence our spring and summer rain are the Indian Ocean and the waters surrounding northern Australia.
First the Indian Ocean. Like the Pacific, and indeed some think linked to a degree by atmospheric processes, there is a pattern of sea surface temperatures in the Indian Ocean that is connected to central and southeast Australian rainfall. Climatologists call this pattern of ocean temperatures the 'Indian Ocean Dipole', or 'IOD'.
When it's warm in the west and cool in the east of the Indian Ocean we have a positive IOD pattern and rainfall shifts away from Australia. Conversely, warm conditions in the east and cool in the west mean a nice set-up for Aussie rain called a negative IOD. Typically (i.e. about 70 per cent of the time) the IOD ranges from about +0.4 to -0.4.
So this week last year, what was the IOD? A fairly impressive -1.0. Belting along and all primed for bringing down the wet stuff. And this week: +0.8. Yes, positive and a humongous 1.8 different from 2010. Mmmm ...
Finally, we have northern Australia and its sea surface temperatures (of course we have an acronym for that too: SSTs). When the water to our north is warmer than normal there's greater evaporation and hence there's more moisture floating about to rain down on the continent. Conversely, when it's cooler than normal there's a little less evaporation going on. I've written enough already, so you be the judge - check out the maps below.
Spot the difference?
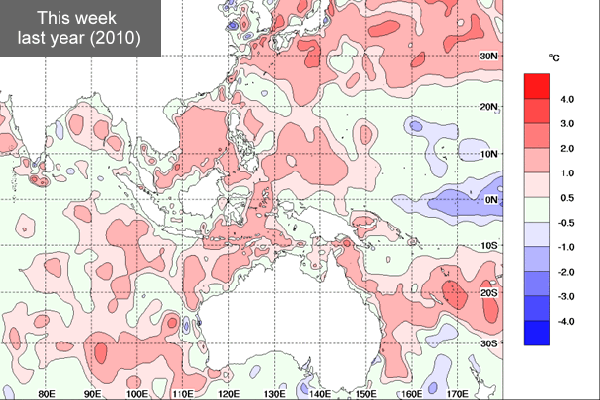
Figure 1. Differences from normal sea surface temperature; 19-26 September 2010
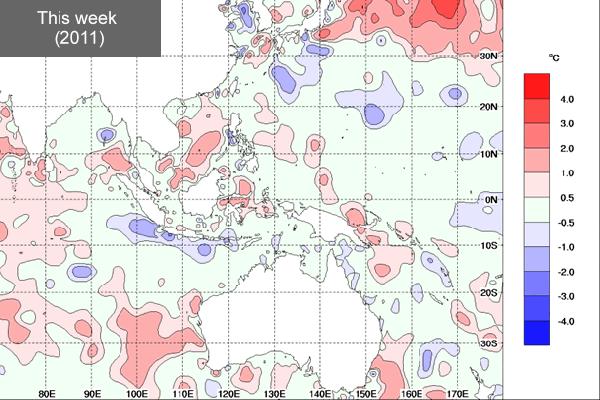
Figure 2. Differences from normal sea surface temperature; 19-25 September 2011
Yep, a lot warmer around Australia last year than this year.
So lump that all together, and what do you get? Last year at this time: a raging La Niña, a ripping negative Indian Ocean Dipole and record warm sea surface temperatures off our northern coast (indeed 2010 brought the warmest ocean temperatures on record around Australia).
For Aussie rainfall, that's tick, tick and tick. And BIG TICKS at that. As one colleague said in our September 2010 monthly climate meeting: "If it doesn't rain now, Australia can pack up and go home." And right he was. Rained cats and dogs.
This year we have a neutral Pacific Ocean (granted on the 'La Niña' side of things and a La Niña remains possible), a positive Indian Ocean Dipole and average to slightly cool temperatures off our northern coasts. For rainfall that's a two-thirds tick, a cross and bit of a dashed line.
But as we said at the start, it's all about shifts in the odds when it comes to climate and the impact of climate drivers. Yes, we'll expect rain this summer and yes, the drivers can and indeed will change, but when you compare where we stand right now to where we were last year it's like chalk and (a little bit chalky) cheese.
Dr. Andrew B. Watkins
Manager of Climate Prediction Services, Bureau of Meteorology

Photograph: John Ferrier.
Article URLs
- More details on the current state of ENSO and the IOD are available via the Bureau's 'ENSO Wrap Up', which is issue every fortnight. The next update is on 12 October. http://www.bom.gov.au/climate/enso/
- Long-range model forecasts for ENSO and the IOD are also updated fortnightly. http://www.bom.gov.au/climate/ahead/ENSO-summary.shtml
- The Bureau of Meteorology issues seasonal forecasts (i.e., next three months) every month. http://www.bom.gov.au/climate/ahead/
- If you want to read more about the science of the drivers of Australian rainfall, a paper by Bureau scientists Dr. Bertrand Timbal and Dr. Harry Hendon was recently published in the American Geophysical Union journal 'Water Resources Research'. http://www.agu.org/journals/wr/wr1109/2010WR009834/
Comment. Tell us what you think of this article.
Share. Tell others.