
What to expect from the climate when the outlooks are neutral
29 March 2018
Sometimes the patterns in the oceans and atmosphere that drive Australia's climate aren't strong enough to steer us towards a wetter- or drier-than-average season, resulting in a neutral, or 50:50, outlook. So what does that mean for the upcoming season—and how can it help you with planning?
Why are likely conditions for some seasons clearer than others?
Some climate drivers, such as El Niño or the Indian Ocean Dipole, have a clear and sometimes strong impact on Australian rainfall and temperature patterns. For instance, El Niño winters and springs are typically drier and warmer than average for much of eastern Australia.
But there are times when the drivers of our climate are not strong enough to push us towards a season dominated by more wet or dry, or hot or cool, weather. This can also happen if different climate drivers are showing opposite impacts—they can cancel each other out.
When our climate does not have a strong push one way or another, our outlook maps are often white—a neutral or '50:50' outlook map.
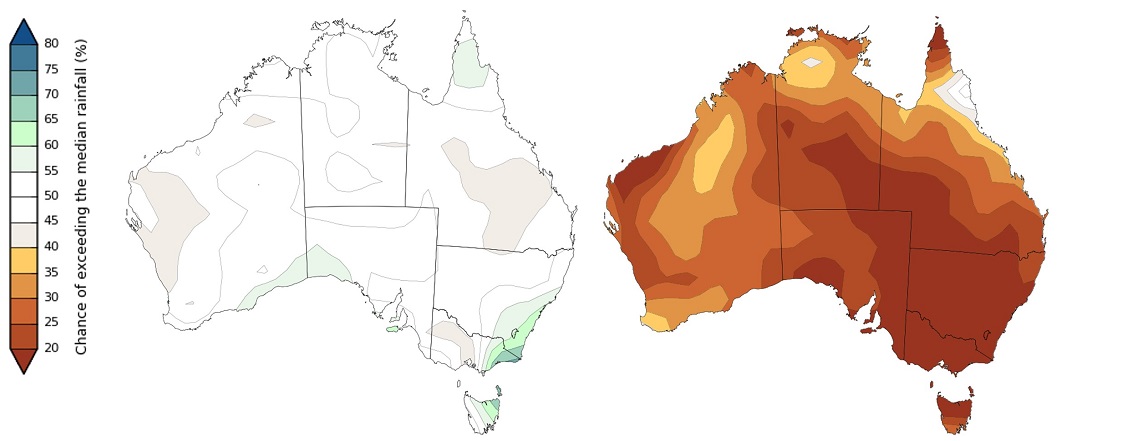
Image: The rainfall outlook map for April–June 2018, issued 15 March (left) shows most of Australia in the neutral/50:50 range (so coloured white). In contrast, the rainfall outlook map for October 2015 (right) shows a low chance of exceeding the median (so brown dominates the map).
But a 50:50 outlook map doesn’t mean we're taking a guess or that there is no indication of what's happening with our weather and climate. In fact it's giving us some key information.
What does a neutral outlook mean?
Let's focus on rain. A neutral climate outlook means there is a 50 per cent chance of seeing above-average rainfall. Or in other words, there is an equal chance of getting above- or below-average rain over the coming season.
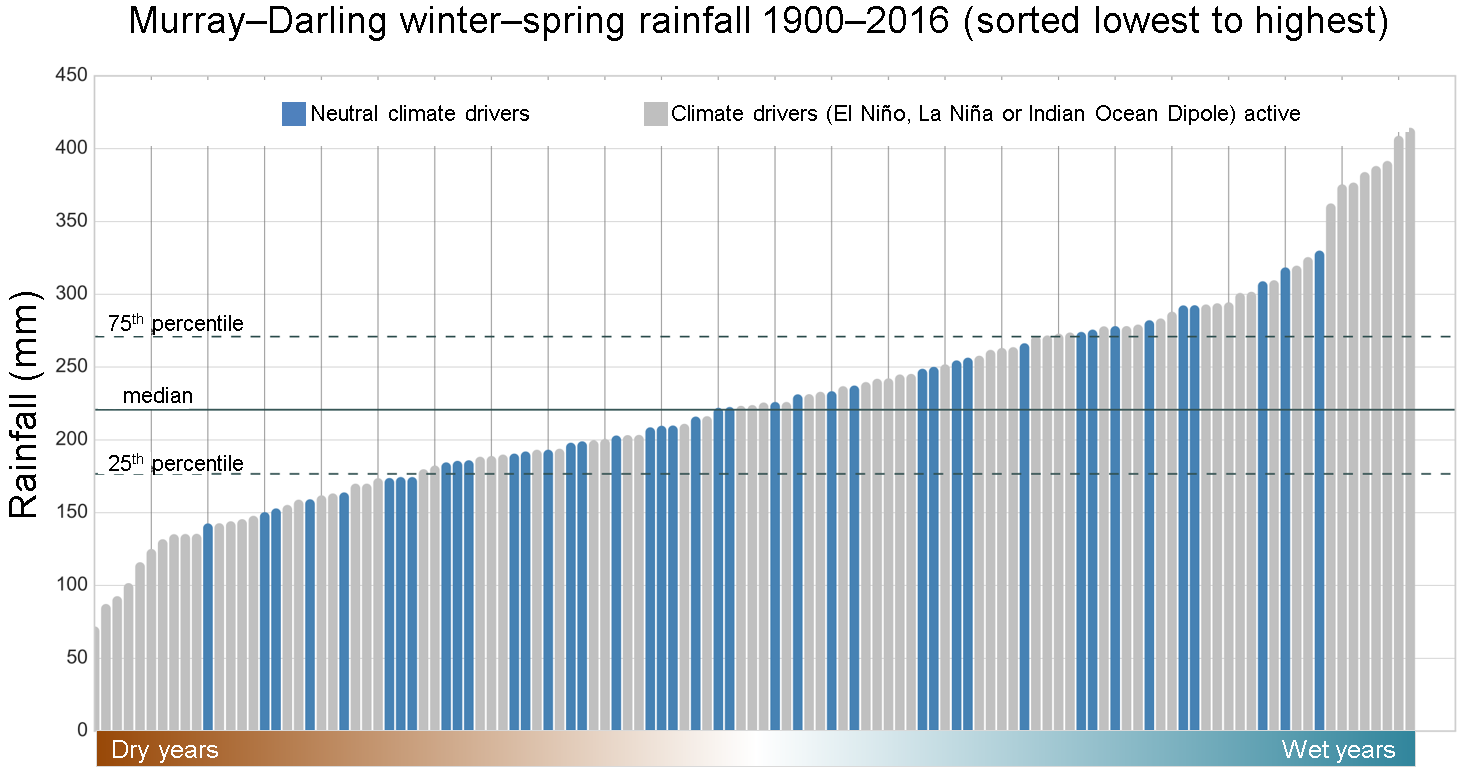
But it doesn’t mean that the most likely rainfall is spot-on average. Have a look at the graph below for rainfall in the Murray—Darling Basin. It shows the years reordered from lowest rainfall to highest rainfall. Years with no strong climate driver, or no strong push from the climate system one way or another, are in blue.
Most winter–spring periods (29 out of the 40 years, or about three quarters of all years) fall within the middle 50 per cent of past rainfall totals, as indicated by the 25th and 75th percentile lines. But within that middle 50 per cent, the rainfall in neutral years is fairly evenly spread—it isn't clustered right in the middle, or dead on average.
This means two things.
First, that a neutral year will typically bring quite variable rainfall, with periods of above- or below- average rainfall. We also know that the above or below patterns tend not to be as widespread as during stronger La Niña or El Niño periods.
Secondly—and importantly—it also means there is less chance of extremely wet or extremely dry conditions over large areas; a good sign if drought or flood is a concern.
What doesn't a neutral outlook mean?
A neutral outlook certainly doesn't mean climatologists are having a bet each way. We can think about this in terms of a football game.
Some footy games we are fairly sure will be a one-sided affair—based on previous match performance, players' injuries, whether it's a home or away game etc. On other occasions, those factors aren't in play and the teams are very evenly matched, so the result could go either way. It doesn't mean we don't know much about footy or about the teams that are about to play—it's just that there is no strong indication that one team is far better than the other.
What can I do with a neutral outlook?
So what should you look at during neutral periods to get an idea of what's possible for the upcoming season? Well there's lots of additional information on our climate outlooks website apart from the chance of seeing above normal (or median).
For a start, think about your local rainfall at a particular time of year, and what range you typically have in years without flood or drought. Use our rainfall ranges information to see your current rainfall accumulation, and what result you'll get in a few months time if a typical range (wet, dry or average) of rain falls over the season.
The seasonal outlook itself may also be useful. For example, if you need a certain amount of rainfall, say 100 mm over the next season, you can check out the likelihood of that happening. Or looking at it the other way round, what rainfall amount has a 25 per cent (less likely) or 75 per cent (more likely) chance of occuring. Find this information on our website:
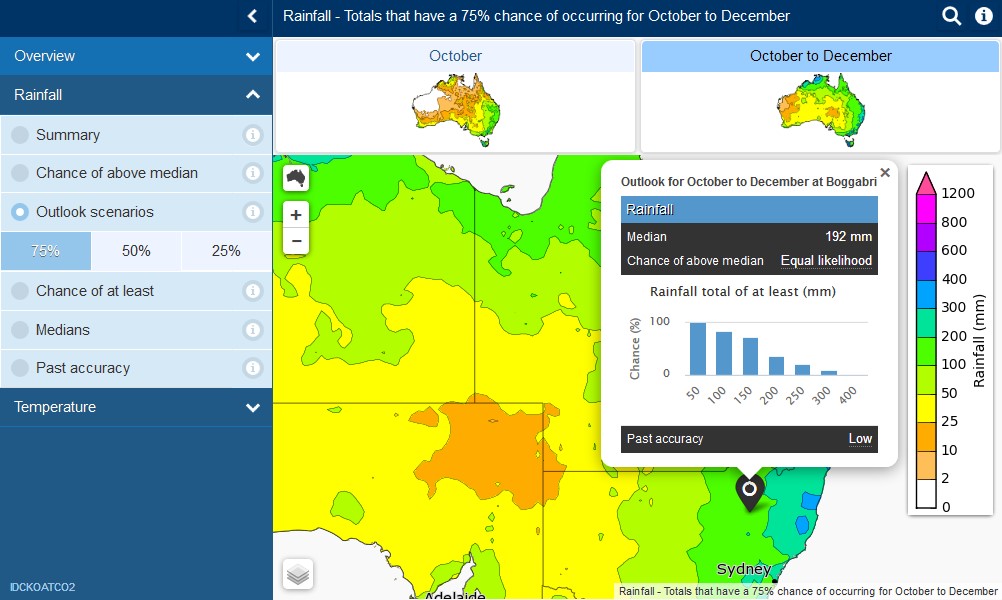
Image: The climate outlooks website, with the rainfall outlook scenario for Boggabri selected, showing the totals with a 75 per cent chance of occurring.
Other tools worth worth looking at in neutral periods include:
Streamflow forecasts—see whether streamflows are likely to be high/low or near average in your region.
Soil moisture guidance—assess your soil moisture for daily and monthly periods.
And you can find the typical rainfall range for your area in Climate Data Online. Select 'Weather and Climate' at the top and 'Monthly' statistics.
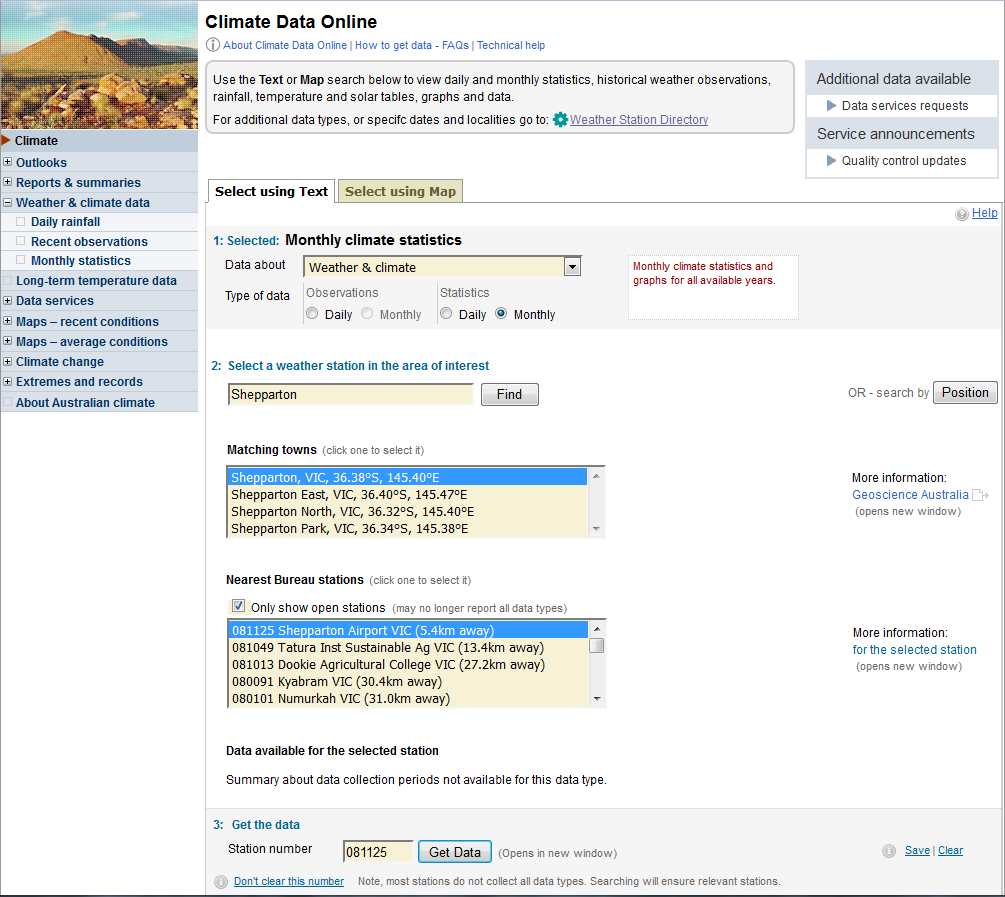
Image: The Climate Data Online website, with the Shepparton weather station selected.
So don’t dread those white maps…
All of us—including the climatologists—wish the outlooks were always clearly wet or dry, or hot or cool. It would certainly make all our lives a lot easier! But when the climate drivers are not strong, or oppose each other, there's rarely any chance of a big push towards one outcome—and that information is still useful.
Best of all, a neutral, or 50:50, outlook suggests that an extreme season is unlikely, and that in most years rainfall will be around the middle 50 per cent of past rainfall totals. Knowing this can help you plan ahead.
What it all boils down to is that climate outlooks help with decisions. A neutral outlook indicates a 50 per cent chance of above-average rainfall. This means there is more chance of good rain than in a season with only 25 per cent probability, but less chance than a season with 75 per cent. If your appetite for risk is high—say a farmer with good soil moisture, full dams and lots of money in the bank—50 per cent may be enough for you to take a punt on a riskier crop. But if times are tough, 50 per cent may not be anywhere near high enough, so you'd make a more conservative decision. No number is ever too small if the return is high enough—most of us have bought a lottery ticket even though the odds can be at least 1 in a million, or 0.0001 per cent.
At the end of the day, a 50 per cent chance is a number just like any other. When combined with your knowledge of what a typical range of outcomes may be, other Bureau information at your fingertips, and your appetite for risk, it can still help you make a climate-smart decision.
More information
Stay on top of what's happening with the climate—subscribe to Climate Outlooks

Subscribe to this blog to receive an email alert when new articles are published.
Comment. Tell us what you think of this article.
Share. Tell others.