
Seeing the water under our feet: groundwater in 3D
09 August 2018
Flowing underground, groundwater is ‘out of sight, out of mind’ for many people. But this hidden resource is vital for communities in many parts of Australia—including some capital cities. To make the best use of groundwater, you need to understand where it is, how it moves and what’s around it—so how is that possible?
A vital water source
Unlike lakes and rivers, groundwater is invisible and many people are unaware of the vital role it plays in Australia’s water supply. In many regions it is the only available water source. Numerous townships, farms and mines, particularly in the outback, are almost completely reliant on groundwater.
Groundwater is pumped out of the ground and used to irrigate thousands of hectares of crops and pastures. And it’s not just rural areas that use significant amounts. About 70 per cent of Perth's water comes from beneath the Swan Coastal Plains, while in Adelaide about 20 per cent of water is sourced from aquifers under the Adelaide Plains.
How do groundwater systems work?
Over time, water from rain and rivers travels through the ground and collects in underground rock fractures or between grains of sediment. These areas are known as aquifers and groundwater can be pumped from them. Something that delays or blocks the movement of water to and through aquifers (such as certain types of rock or soil) is known as an aquitard. The layering and structure of aquifers and aquitards makes up the groundwater system and dictates how water flows below the ground and its interaction with rivers, wetlands and vegetation at the surface.
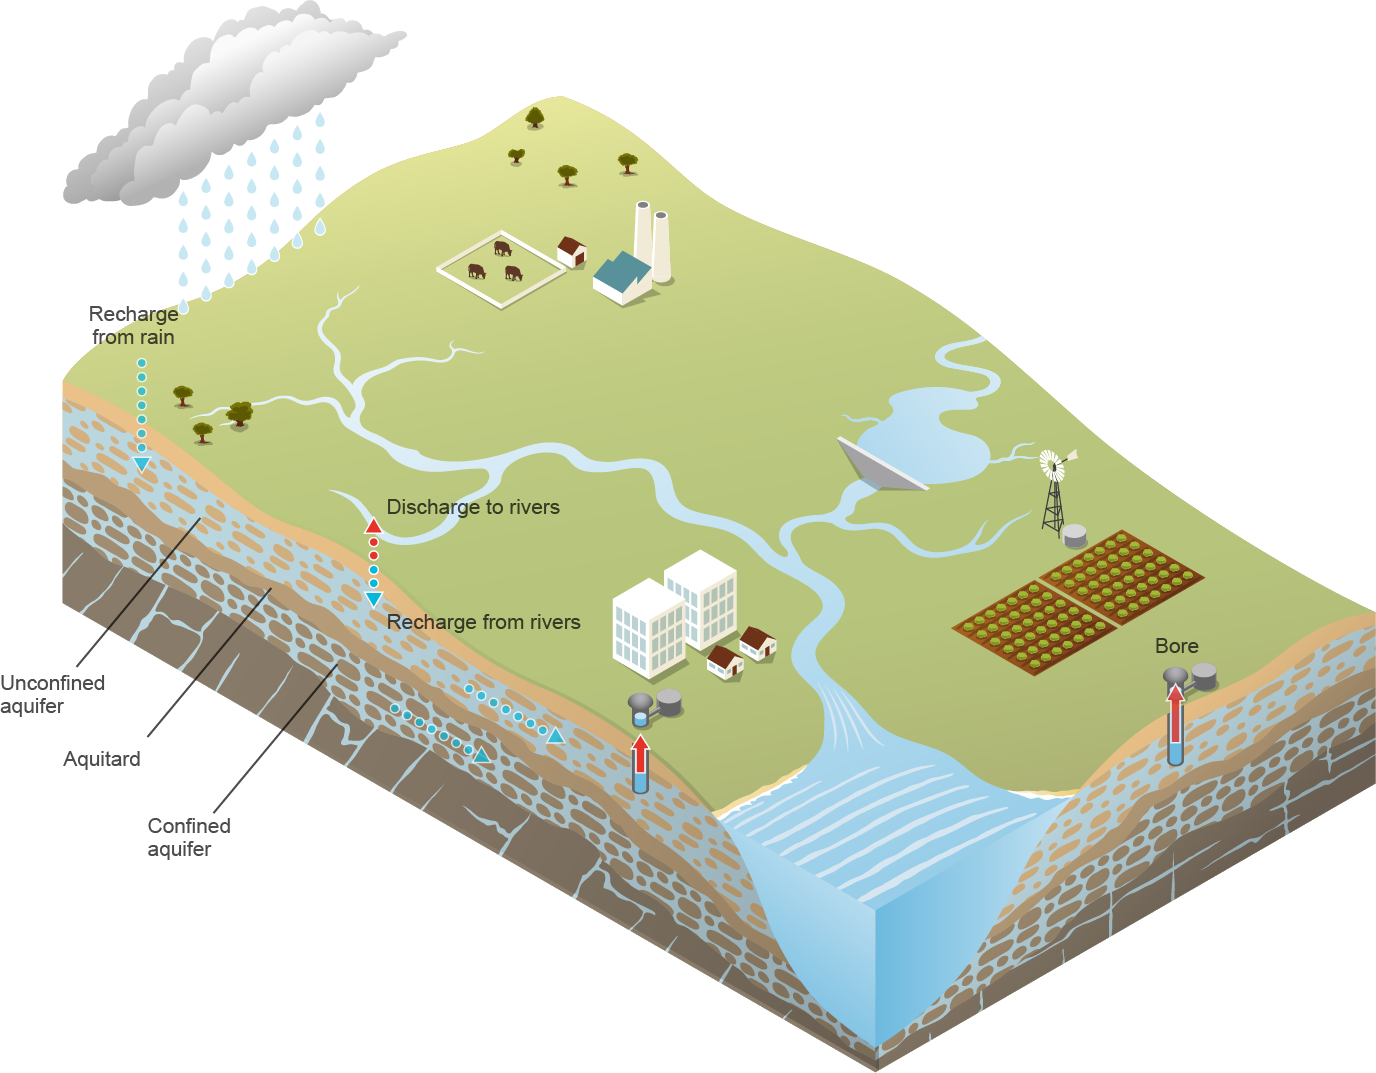
Image: Simplified diagram of a groundwater aquifer system and its relationship with the surface
Seeing underground
Water managers have the difficult job of balancing competing demands for groundwater from agriculture, industry, domestic and cultural requirements, and the environment. To understand how much groundwater is available, how it interacts with surface water features and what the effects might be, managers need as much information as possible about the groundwater system they’re dealing with. The Bureau has a range of tools and resources that help provide this information—one is 3D visualisations of Australia’s major aquifers.
These visualisations are useful in decision-making. They can help water managers choose suitable aquifers into which to inject surface water, to store until it is needed. Managers can see where groundwater is most heavily extracted from aquifers and place caps on extraction rates where necessary to prevent levels declining. Managers can also visualise where water is recharging the aquifers, and likely flow directions, to help assess potential impacts of groundwater extraction on other users or nearby surface water features.
The 3D visualisations show a number of groundwater features including: locations of aquifers and aquitards; locations of groundwater bores and the aquifers they target; and the presence of groundwater management areas. They’re interactive—you can zoom in and out, rotate around and look at the aquifer area from all angles. We’re working with State and Territory governments and other agencies such as Geoscience Australia to make more of these available.
You can access 3D visualisations on the Australian Groundwater Explorer and download them in PDF format to view and share offline.
St Vincent Basin in 3D
St Vincent Basin underlies Adelaide and the surrounding areas. The 3D visualisation shows it is a complex aquifer system, containing multiple aquifers (shades of blue) and aquitards (shades of brown), with high levels of groundwater use (bores shown as green dots).
St Vincent Basin is partially covered by two groundwater management areas. The Northern Adelaide Plains Prescribed Wells Area (PWA) lies just to the north of Adelaide and covers the T1 and T2 limestone aquifers, from which large volumes of groundwater are extracted for crop irrigation. The Central Adelaide Plains PWA covers most of the metropolitan area, which has a high density of irrigation bores—most of which are shallow ‘backyard bores’ that draw water from sand layers within the Hindmarsh Clay to irrigate gardens. Some deeper T1 aquifer bores are used for industry or the irrigation of parks and golf courses. There are fewer groundwater bores located in the north, where the aquifers thin out and so less groundwater is available for extraction.
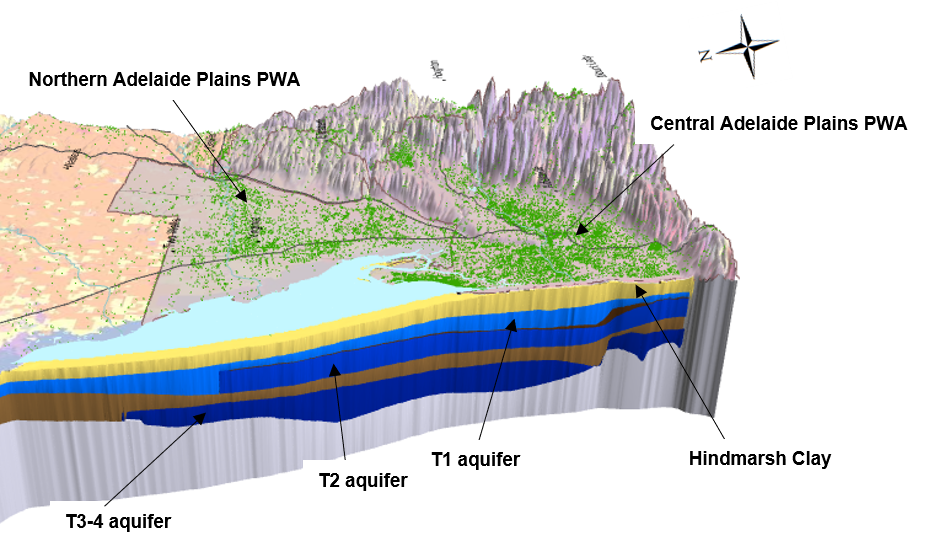
Image: Groundwater aquifers near Adelaide
The birds-eye view of the various layers below provides clues to the geological history of the basin. The T1 and T2 limestone aquifers represent the extent of the ocean at different times in the last 60 million years (limestone is formed from the skeletons of marine animals such as coral and molluscs, which tells us these areas were once underwater).
The extent of the T2 limestone aquifer indicates that the sea level was once much higher in the geological past. The sea level then receded, resulting the Munno Para Clay aquitard (clay being formed under dry conditions). The sea level rose again after that, creating the T1 aquifer. As you can see in the view below, the younger marine limestone (T1 aquifer) does not extend as far northeast as the older limestone (T2 aquifer). This suggests that gradual uplift of the basement rocks restricted the extent of the more recent sea-level rise. As there is no aquitard covering the T2 aquifer in the northeast, it is likely to be receiving recharge from rainfall and the overlying river there.
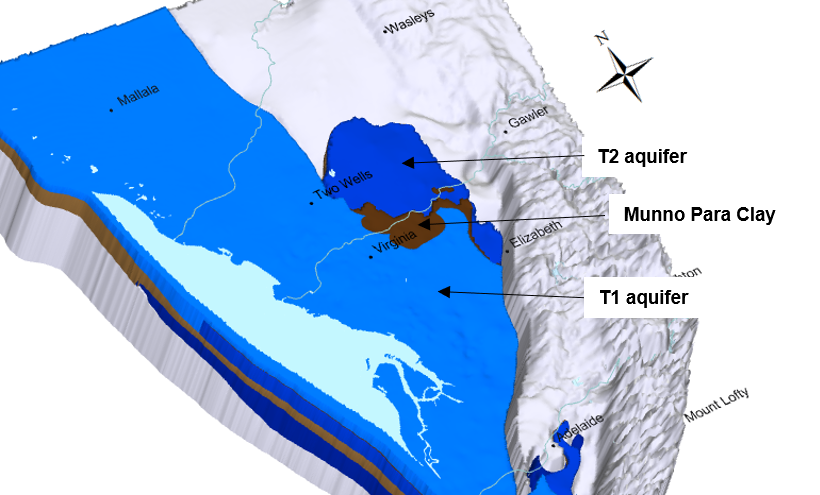
Image: The extent of the T1 and T2 aquifers provides insight into past sea-level rises
The cross sections available in the 3D visualisations can help illustrate the impact of faults in the basin. In the view below, the Para Fault has caused a displacement of the sedimentary layers. The Munno Para Clay aquitard is continuous across the Para Fault, maintaining a less permeable boundary between the T1 and T2 aquifers. This is an important consideration for water managers who are considering the possibility of pumping surface water into the T1 and T2 aquifers, recharging them during times of high streamflow so that this water could be extracted at a later date when there is less surface water available.
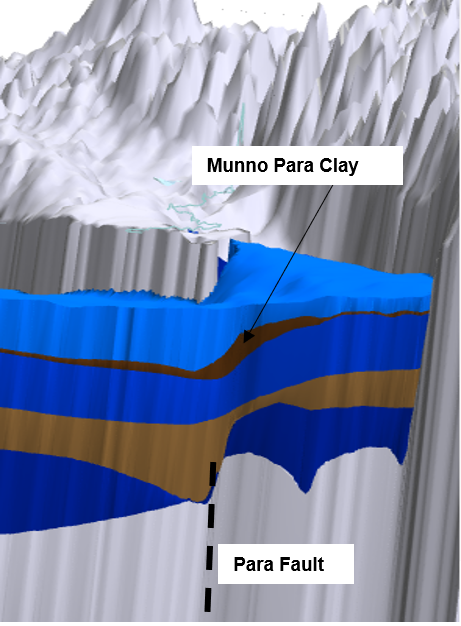
Image: 3D visualisation helps illustrate the impacts of faults, such as the Para Fault
As you can see from this example, there are several useful insights into the basin's past and present, such as where an aquifer is receiving direct recharge from rainfall, or ideal locations for storing surface water in this aquifer system. These kind of 3D visualisations are invaluable for increasing understanding of this vital but often overlooked resource.
More information
Find out more about groundwater around Australia through the Bureau’s groundwater information suite.
Far from bore-ing: What is groundwater?
Mapping groundwater-dependent ecosystems
The Australian Groundwater Explorer: A new way of exploring our precious underground resource

Subscribe to this blog to receive an email alert when new articles are published.
Comment. Tell us what you think of this article.
Share. Tell others.