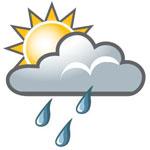
Icons - what do they mean to you?
12 January 2012
Iconography - the use of images and symbols to communicate information - is centuries old. It is studied widely and taught in various design disciplines. But designing icons is not without its difficulties.
Difficult concepts, culturally diverse audiences
Some concepts are not easy to represent visually. For instance, can you imagine trying to design a visual representation of 'brown rot warnings' for the agricultural industry?
Added to this difficulty, people's interpretation of icons can vary, based on their background, experience and perspective. When communicating with a culturally diverse community, designing icons that can be widely understood is a real challenge.
Meteorological iconography
The Bureau, along with other meteorological agencies, uses icons to supplement text-based communication, particularly on the web. We use icons to enhance our main navigation links, and a key use is on our weather forecast pages.
Our designers aim to produce icons that act as quick visual stimuli, easily understood by our users. A forecaster who uses a tropical cyclone icon needs to be confident that it will be understood by those who need to act on this information.
For information on what our icons represent, see the 'weather elements' and 'cloud cover' tabs at Weather Words.

Weather icons used on the Bureau of Meteorology's forecast pages.
Icons or text only - which do you prefer?
Compare our content supplemented by icons, with content that is text only. Which do you prefer?
| Text with icons | Text only |
|---|---|
| Adelaide forecast | Brisbane forecast |
| Canberra forecast | Darwin forecast |
| Hobart forecast | Perth forecast |
| Melbourne forecast | |
| Sydney forecast |


Comment. Tell us what you think of this article.
Share. Tell others.