
Summer 2019 sets new benchmarks for Australian temperatures
05 February 2019
Australian summers are well known for bringing heatwaves, bushfires, tropical cyclones and floods. Against this backdrop of severe weather, it can be hard to recognise patterns which are unusual, sitting outside of the range of normal climate conditions. While summer still has a month to run, climate data already show it will go down as one of the most extreme our nation has seen. So how extreme is it and what's causing the hot, dry conditions?
Late November and December 2018
After a relatively benign start to November (national mean temperature 0.93 °C above the 1961–1990 average for the month, national rainfall 16 per cent above average), late November saw the development of extreme temperatures in the northeast of the country. Impacts of this include adverse effects for tropical agriculture, multiple bushfires in the coastal ranges (some in rainforest areas) and the death of large numbers of bats. This heatwave was fed by a range of factors including a lack of cloud, particularly dry conditions in the interior, unusual weather patterns, and the background warming trend. Since then the heat has been almost relentless for many parts of the country—and unprecedented in scale and duration.
December was record-hot. For the nation as a whole, the mean temperature was 2.13 °C above the 1961–1990 average, with maximum and minimum temperatures 2.41 °C and 1.85 °C above average respectively. All three broke the previous record, set in December 1972—the peak of a major El Niño event which brought drought to much of Australia. December was a dry month overall, though severe tropical cyclone Owen during the first half of the month, and to a lesser extent, tropical cyclone Penny at the end of the month, delivered heavy rain including record monthly totals to parts of tropical Queensland.
December also featured a remarkable dome of hot air over the country, which meant that the temperature for Australia as a whole was above average for all but two days. This hot air wasn't flushed away by significant cold fronts, and remained over Australia throughout the month. Temperatures were particularly extreme in the days following Christmas, with 27 December registering the highest average maximum temperature for all December days since 1910. Temperatures peaked at Marble Bar, in Western Australia, with 49.3 °C, a new December record for that location, and just below the national December record of 49.5 °C (Birdsville, 1972).
January 2019
January 2019 set a new national mean temperature record, 2.91 °C above the 1961–1990 average of 27.9 °C. Not only does this make it our hottest January on record, but the national mean temperature of 30.81 °C is Australia's hottest for any month, breaking the record of 29.82 °C set in January 2013.
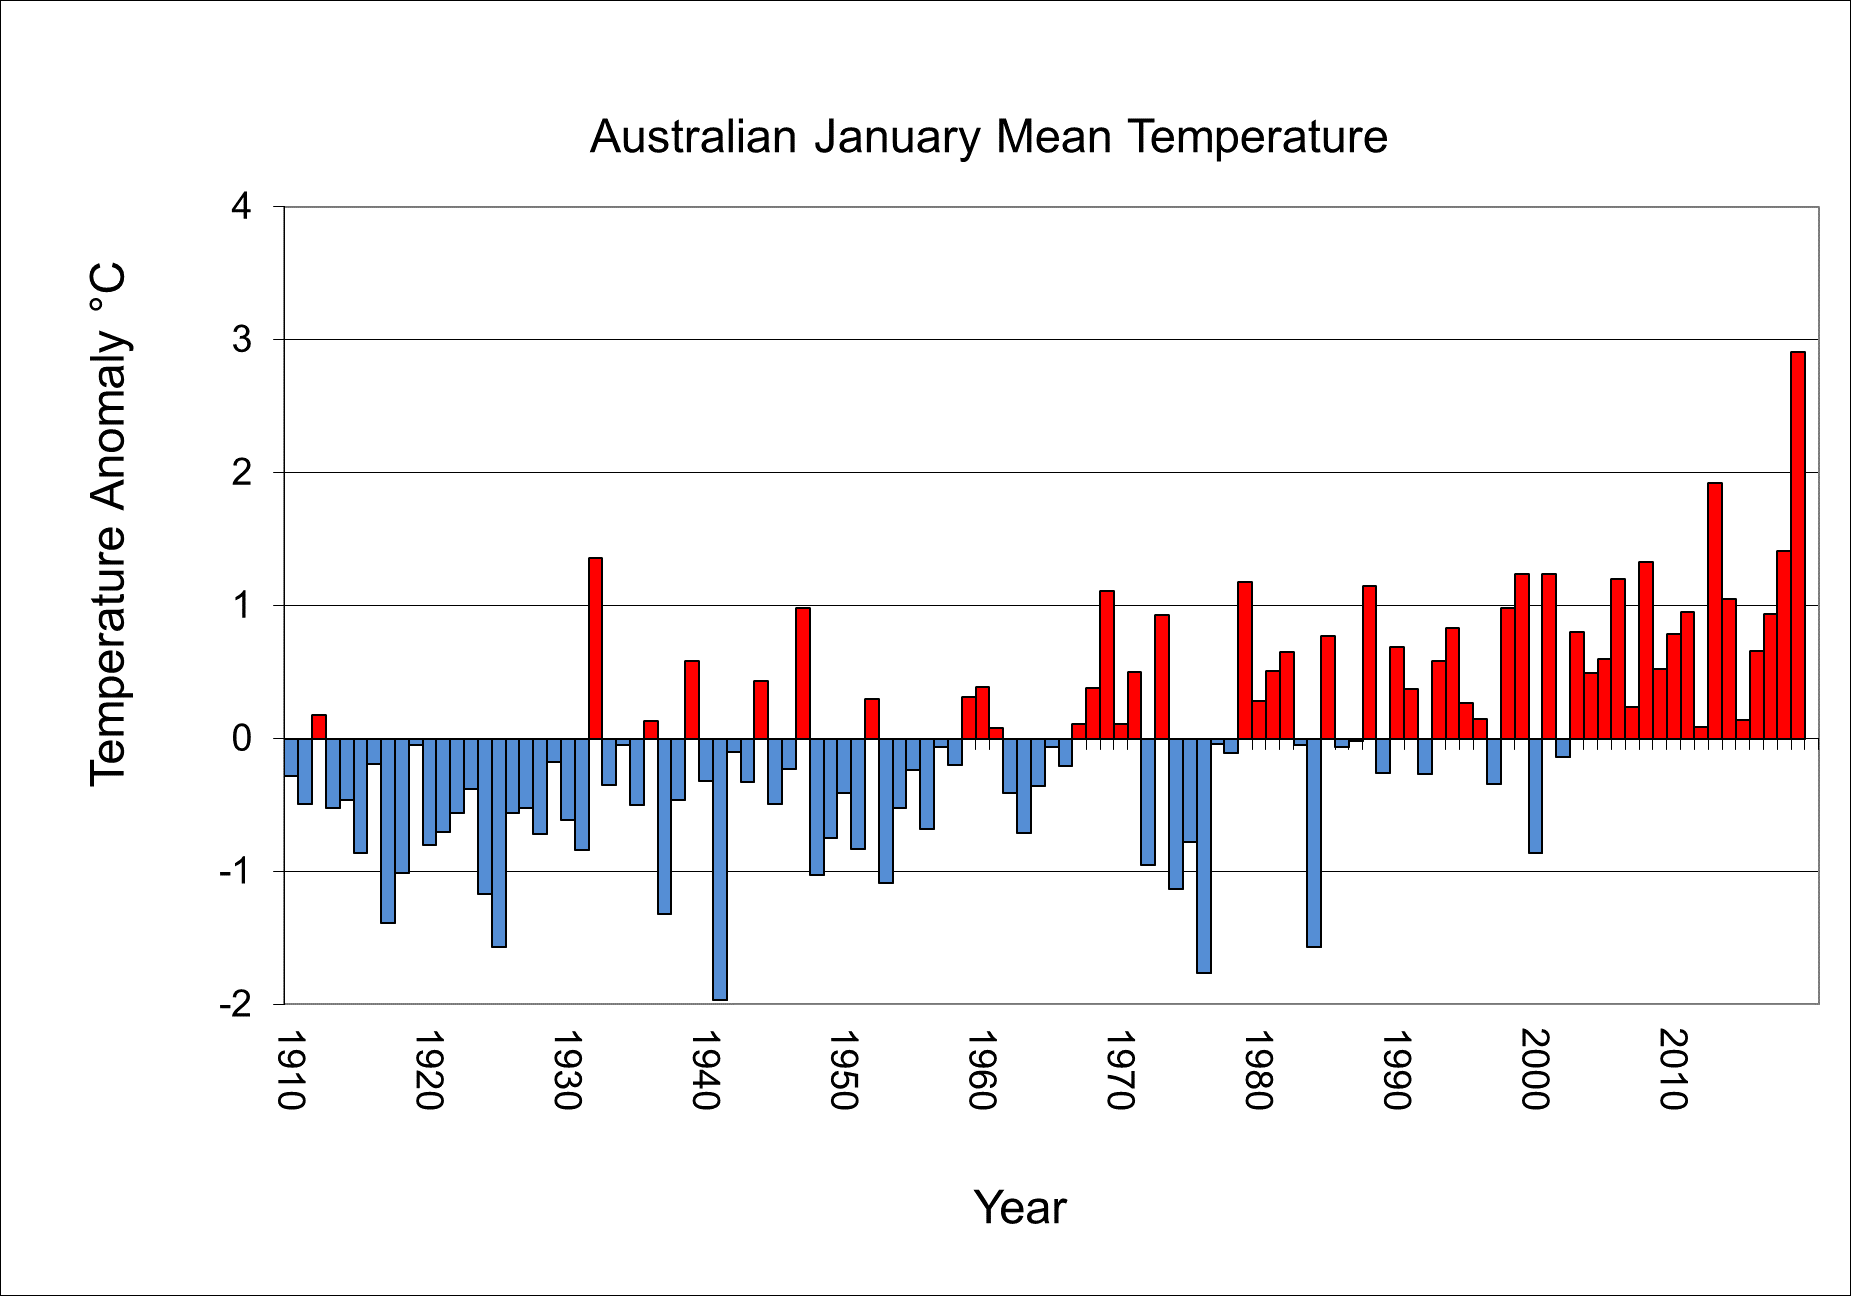
Graph: Australia's January mean temperature variation from average 1910–2019
The list of area-average records broken for the month is simply remarkable. Australia experienced its warmest January on record in terms of mean, maximum, and minimum temperatures, breaking its monthly mean temperature record by just under 3 °C. New South Wales, Victoria, Queensland, Tasmania and the Northern Territory experienced their warmest mean temperatures on record for January, with New South Wales just over 2 °C above its previous record, while South Australia and Western Australia recorded their second-warmest January. Data for all States and Territories are published in our Climate Summaries.
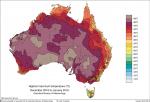
Graph: During December–January, temperatures were unusually warm and in large areas of the country they were highest on record
The heat was accompanied by generally dry conditions, with the national average rainfall, of 49 mm, 38 per cent below the long-term mean. Most parts of the country saw low rainfall, with the most notable exception being coastal tropical Queensland, where a persistent monsoonal low late in the month brought heavy rainfall and flooding in some areas. The monsoon was particularly late to develop in the northwest of Australia, starting at Darwin on 23 January, nearly a month later than usual and the second-latest on record, behind
1972–73.
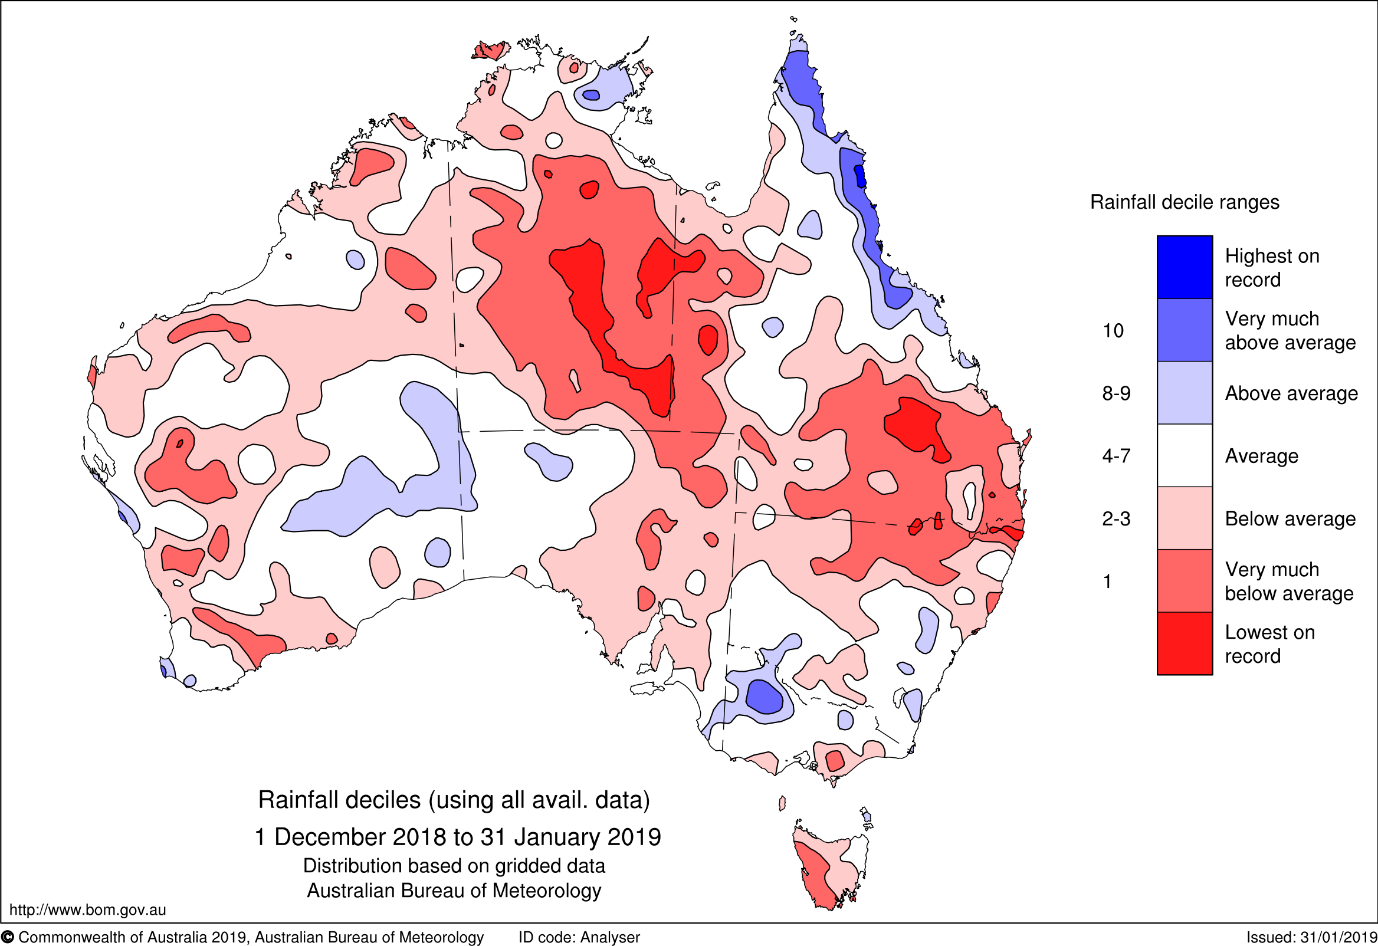
Map: During December–January, most of Australia saw below-average rainfall
The high average temperature reflected a lack of cooler conditions (every day was warmer than average) and persistent heat. Eight of the ten hottest days on record, as measured by national area average temperature, occurred during the month, with three exceeding the previous daily record set in January 2013. Many station records were set, including for Adelaide (46.6 °C at West Terrace/ngayirdapira—a new record for a capital city centre), Port Augusta 49.5 °C, Kerang 47.6 °C (a new Victorian January record) and 45.6 °C at Alice Springs—a remarkable number given its elevation of 546 m. Many records were also set for days above thresholds and persistence of heat. In Tasmania, Hobart saw seven days reach 30 °C or above, and 17 days reach 25 °C—both new records for the southern capital. Across the nation, most areas saw a maximum temperature of 44 °C or above at least once during December–January, with large areas reaching a scorching 48 °C.
Minimum temperatures were particularly extreme, with the pre-2019 national record of 35.5 °C broken four times during the month, by Borrona Downs (New South Wales) with 36.6 °C and 35.6 °C, Moomba (South Australia) with 36.1 °C, and Noona (New South Wales) with 35.9 °C. Many locations in New South Wales saw record high minimums during January, highlighting the extreme nature of conditions. The Northern Territory, South Australia and Queensland also saw their highest minimum temperatures on record.
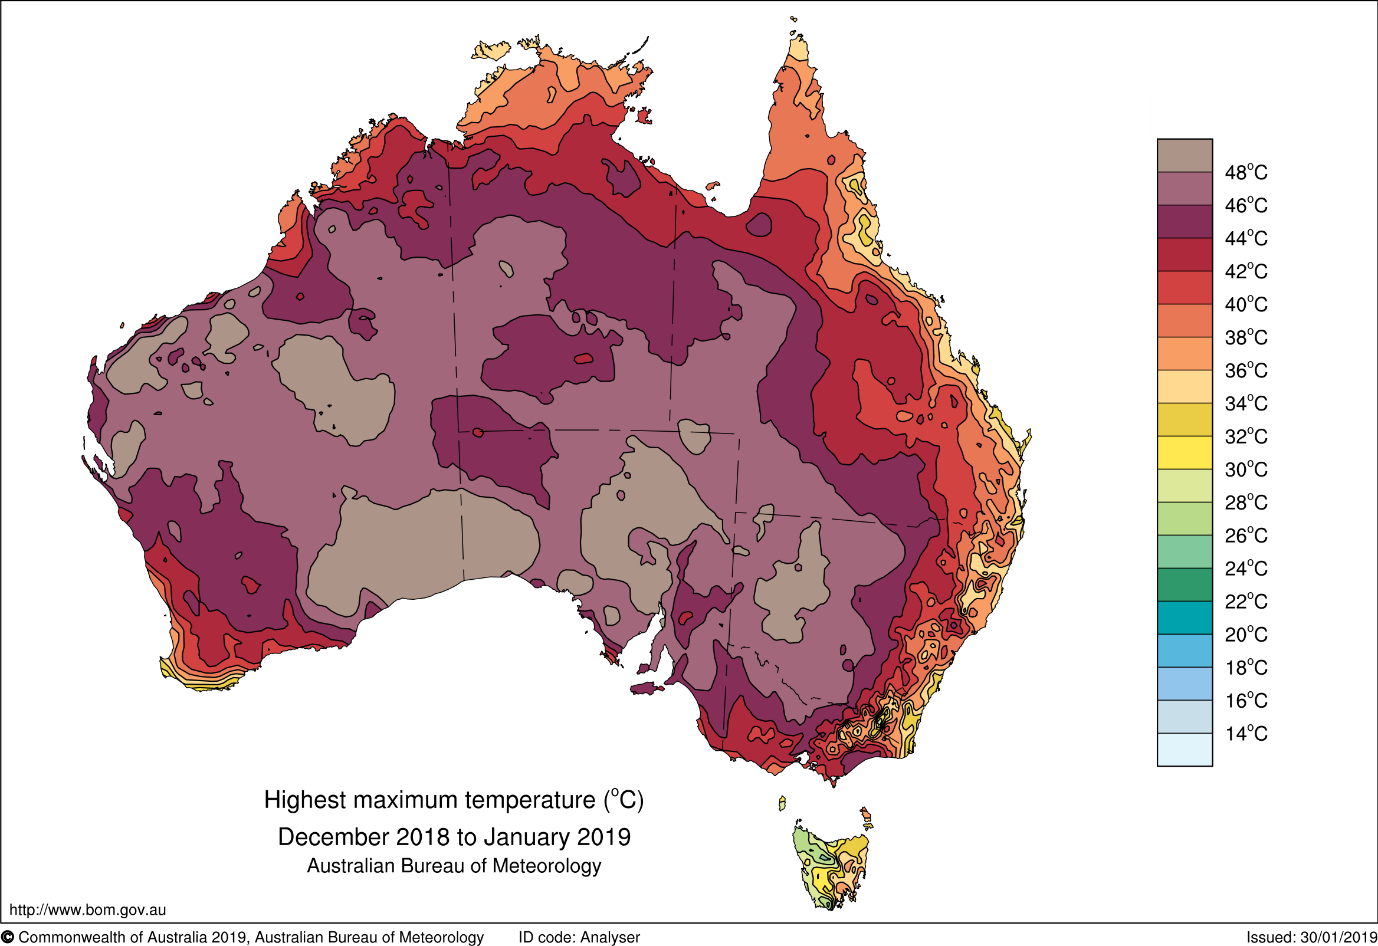
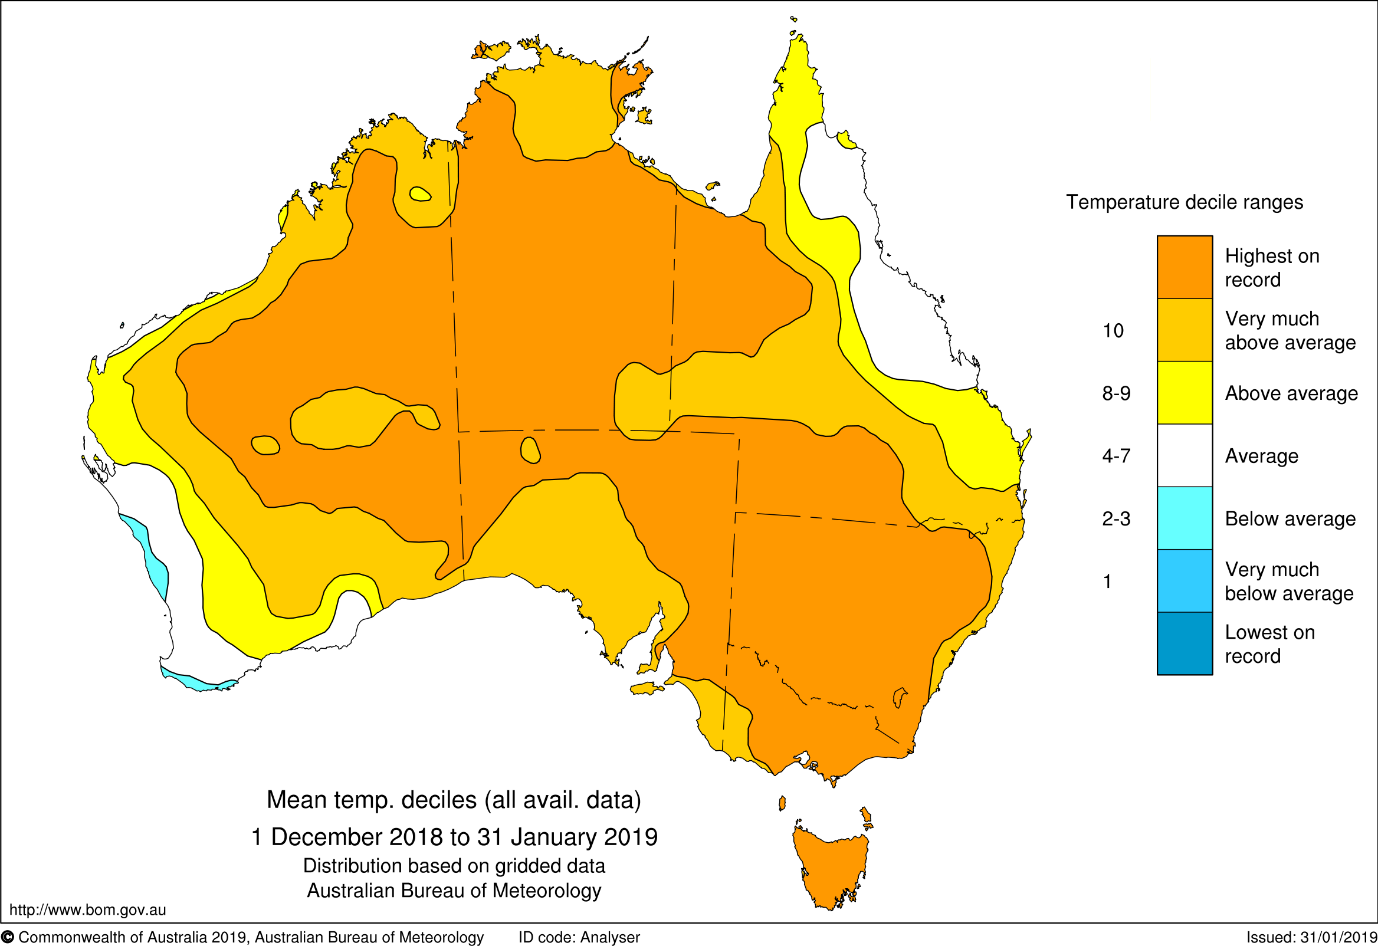
Map: December–January highest maximum temperatures
Why so extreme?
Leading into summer, our Climate Outlooks suggested a high likelihood that temperature would be warmer than normal. While translating probabilities into average outcomes requires caution, such an extreme forecast of warmth suggests that a number of predictable factors were at play.
Classical climate drivers included in our climate models haven't featured prominently, with a positive Indian Ocean Dipole declining in early summer, and the Pacific Ocean experiencing El Niño–Southern Oscillation (ENSO) neutral conditions overall, though with ocean temperatures briefly touching the threshold for El Niño. Ocean temperatures have been very warm to Australia's east in recent months, though these at least partly reflect the stable and sunny conditions which have also led to warm conditions over land. During 2018 we saw significant drought affecting much of the nation, and the delayed monsoon with low rainfall for many areas also clearly played a part.
As the State of the Climate 2018 report outlines, Australia has warmed by over 1 °C since 1910. There is also an increase in the frequency of extreme heat events and these are likely to increase further in the future. The warming trend now means that global and Australian climate variability sits on top of a higher average temperature. Our climate prediction model factors the trend in through the use of modern carbon dioxide concentrations and global temperature data.
There are a range of scientific methods which can be used to provide an objective estimate of whether climate change played a role in this extreme summer. Previous studies have shown that the extreme summer heat of 2013 was at least 2.5 times more likely to occur with the enhanced greenhouse warming. The 2019 summer is shaping to be even more extreme than 2013.
More information
Subscribe to receive climate information emails.
Australia’s 2018 in weather: drought, heat and fire


Comment. Tell us what you think of this article.
Share. Tell others.