
Explainer: what is a La Niña?
29 September 2020
La Niña is a large-scale change in tropical Pacific Ocean temperatures that affects global weather patterns. It's one phase of a natural cycle called the El Niño–Southern Oscillation. So, what causes it and what weather does it typically bring for Australia?
To understand La Niña, it helps to know about the El Niño–Southern Oscillation (ENSO). This is a cycle in Pacific Ocean temperatures, winds and cloud that can influence weather right around the globe. ENSO moves between three phases – La Niña, neutral and El Niño. The La Niña and El Niño phases can cause extreme weather in Australia, from floods right through to drought.
Video: Watch this short video to understand ENSO and how it affects our climate.
What causes La Niña?
La Niña occurs when tropical Pacific Ocean temperatures cool in the east and warm in the west. This causes equatorial trade winds to become stronger. The stronger trade winds in turn change ocean surface currents, which brings cooler deep water up from below. This causes further cooling of the central and eastern tropical Pacific Ocean. The stronger trade winds also help to pile up warm surface waters in the western Pacific and to the north of Australia.
The warming of ocean temperatures in the western Pacific means the area becomes more favourable for rising air, cloud development, and rain. As a result, heavy rain can fall to the north of Australia. Conversely, over the eastern and central tropical Pacific, air descends over the cooler waters, meaning the region is less favourable for cloud and rain.
The air rising in the west and descending in the east enhances an atmospheric circulation called the Walker circulation. This can cause changes to the climate felt across the globe.
How do we know when La Niña has arrived?
There are some clear indicators of La Niña in the ocean and the atmosphere:
- temperatures in the tropical Pacific Ocean cool, both at the surface and below
- there are changes in surface pressure across the Pacific Ocean – it's higher in the east and lower in the west
- the trade winds are much stronger than normal
- cloud decreases near the International Date Line.
What weather does La Niña bring for Australia?
Every La Niña is different, but typically we see:
- increased rainfall across much of Australia
- lower average daytime temperatures (south of the tropics)
- higher average overnight temperatures (in the north)
- a shift in temperature extremes
- decreased frost risk
- more tropical cyclones
- earlier onset of the monsoon at Darwin.
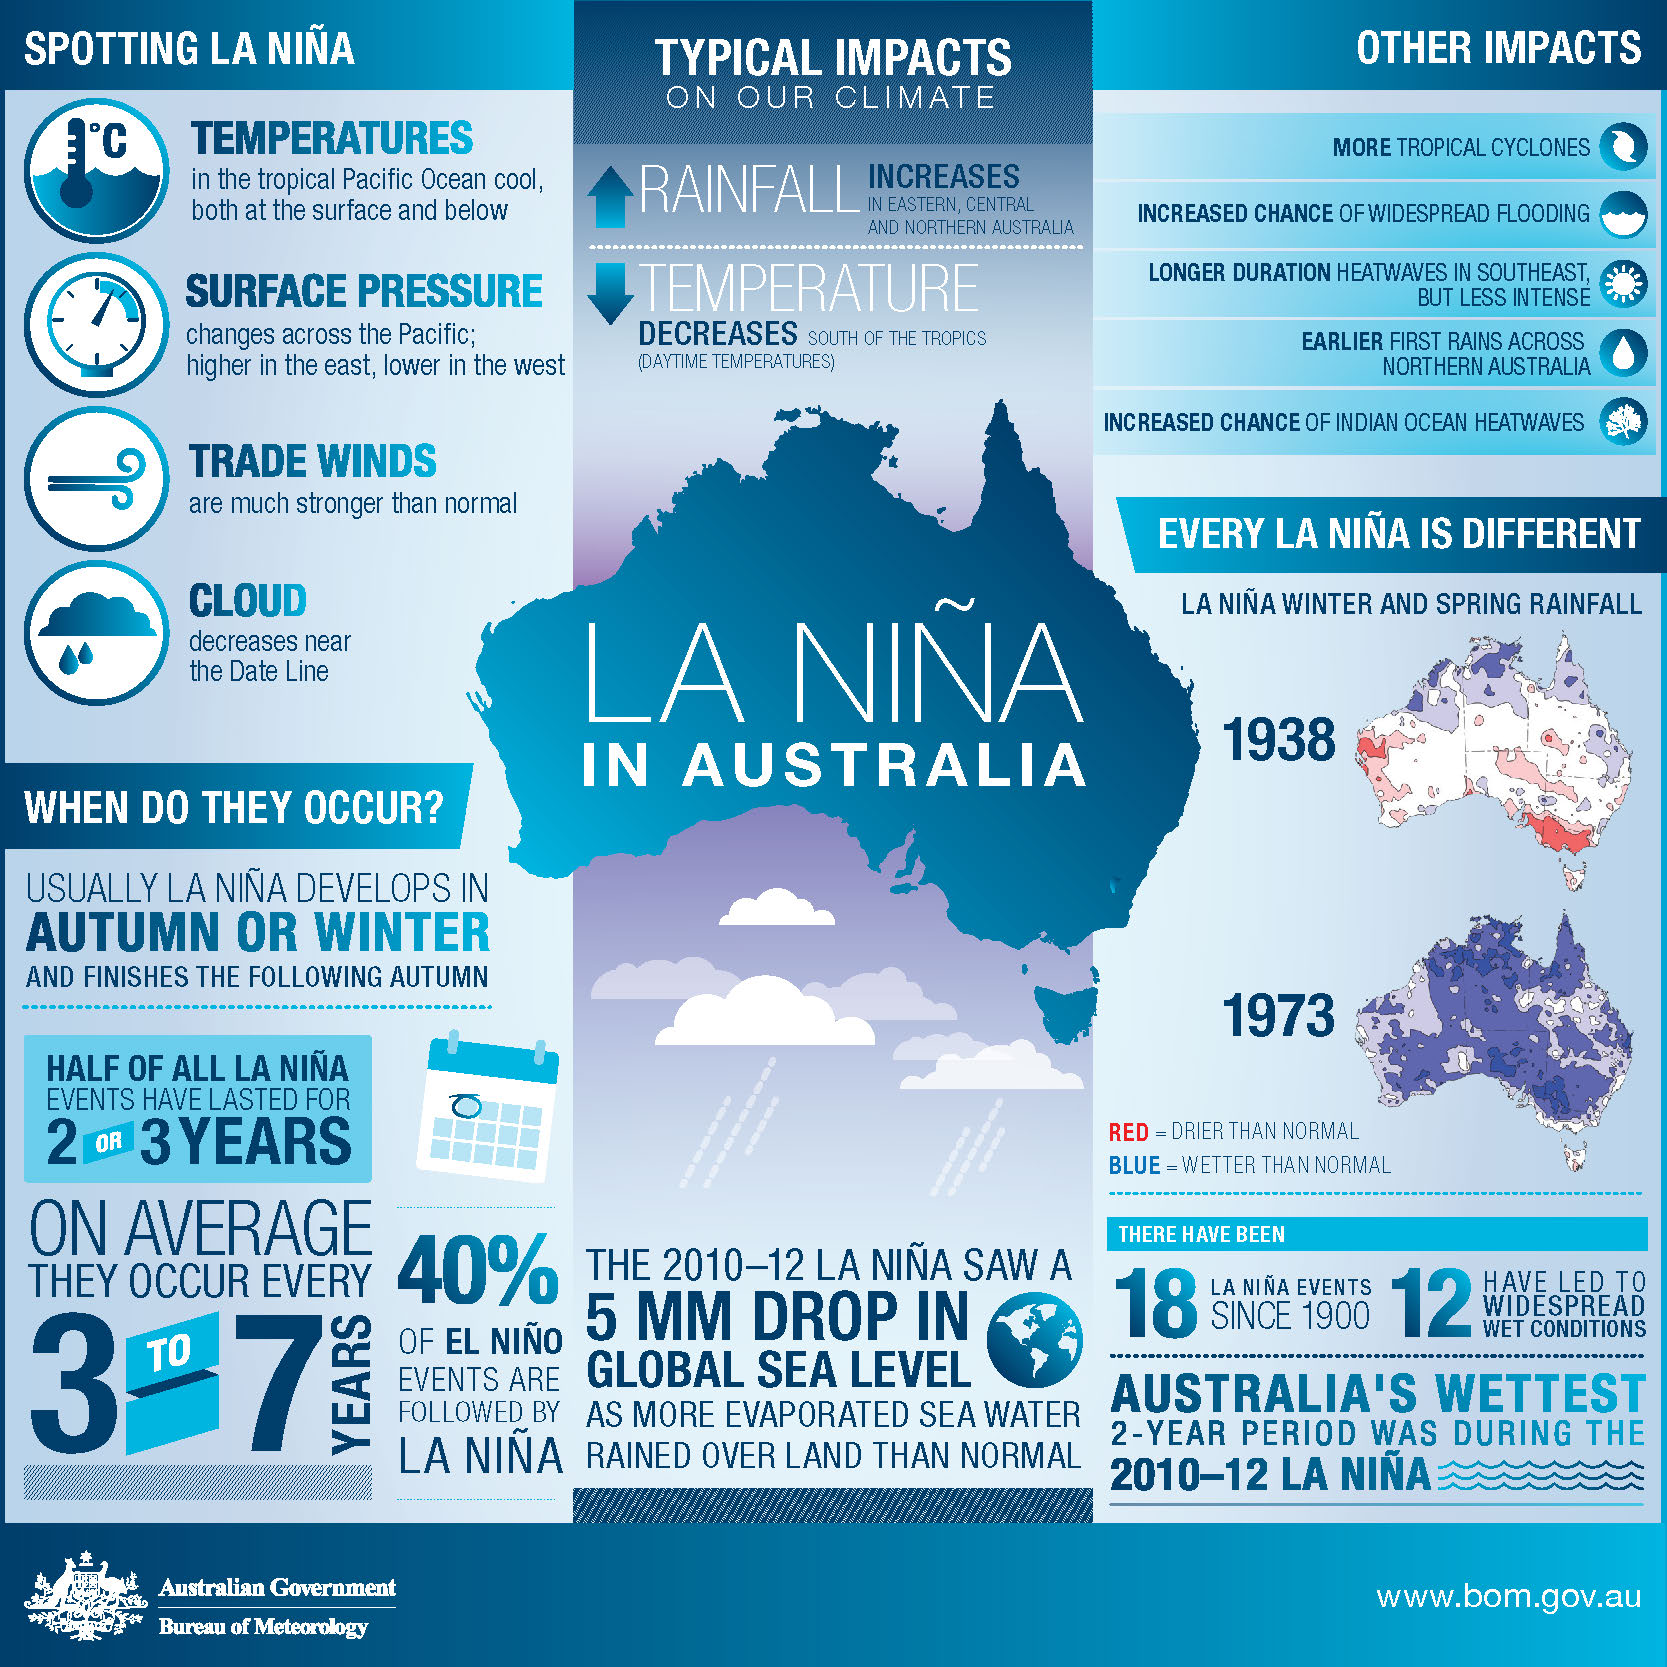
Infographic: La Niña in Australia
Rain and flood
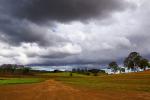
More rain and cloud in the western Pacific usually means above-average winter–spring rainfall for central, northeastern, and eastern Australia. But this effect can vary a lot depending on the La Niña. The severe floods of 1955, 1988, 1998 and 2010 were all associated with La Niña.
The effects of La Niña often continue into the warmer months. In eastern Australia, the average December–March rainfall during La Niña years is around 20% higher than the long-term average. This is particularly notable for the east coast. There La Niña tends to have less influence on winter rain but there can be severe flooding during the summer.
With the extra rain, it's not surprising that La Niña increases the chance of flooding. Of the 18 La Niña events since 1900, 12 caused floods for some parts of Australia. Some areas of northern Australia are likely to see floods because of the increase in tropical cyclones.
There's a close relationship between La Niña intensity and rain. The stronger the La Niña, the more rain is likely. The greater the sea surface temperature and surface pressure differences from normal, the stronger the La Niña is considered to be. Two of the three wettest years on record for Australia were during the strong 2010–2012 and 1974 La Niña events. The second-wettest year on record was during the 1998–2001 La Niña.
The Indian Ocean Dipole (IOD) is another climate driver that can affect Australia's rainfall. If a La Niña happens at the same time as a negative IOD its influence can widen and some western areas can also see increased rainfall. La Niña on its own has less of an influence in the west.
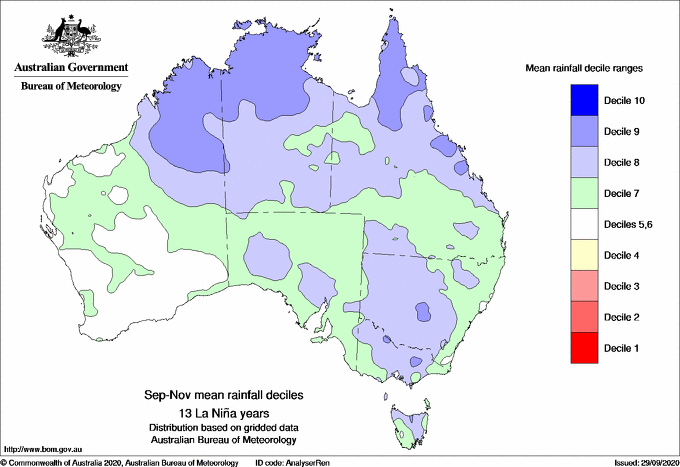
Map: Spring rainfall deciles averaged for 13 strong La Niña events.
Cooler and warmer conditions, depending where you are
La Niña years tend to bring below-average maximum temperatures across most of mainland Australia south of the tropics. This is particularly the case during the second half of the year. It's due to increased cloud cover and rain. However, the cloud cover also acts as an insulator. It can cause above-average minimum temperatures and greater humidity across northern and eastern Australia.
The below-average daytime temperatures mean fewer extreme daily high temperatures. In La Niña summers heatwaves can be less intense, but more humid and across southern parts of the country they can last longer. This has been observed in the past for locations such as Adelaide and Melbourne. They have fewer individual daily heat extremes but more frequent prolonged warm spells. Of the 32 Victorian heatwaves between 1989 and 2009, 17 were during La Niña years. Only 6 were during El Niño (Parker et al 2014).
The increased cloud cover means warmer nights (on average). Regions of southern New South Wales and northern Victoria can experience fewer frosts during La Niña than the historical average.
More tropical cyclones
During La Niña, there are typically more tropical cyclones in the Australia region. On average, twice as many make landfall during La Niña than during El Niño years. The first cyclone to cross the Australian coast also tends to be earlier in the season. The only years with multiple severe tropical cyclone landfalls in Queensland have been La Niña years. This means an increased likelihood of major damage and flooding related to strong winds, high seas, and heavy rain from cyclones.
Earlier monsoon
The date the monsoon starts in tropical Australia is generally two weeks earlier during La Niña years than in El Niño years. This means that rainfall in the northern tropics is typically above average during the early part of the wet season in La Niña years. It's only slightly above average during the latter part of the wet season.
More information
Stay up to date on ENSO with the ENSO Outlook and the Climate Driver Update (formerly the ENSO Wrap-Up).
Subscribe to receive climate information emails.
View or download the La Niña infographic
Reference
Parker T, Berry G, Reeder M, Nicholls N (2014) 'Modes of climate variability and heat waves in Victoria, southeastern Australia', Geophysical Research Letters, 41 (19):6926–6934, accessed 29 September 2020.

Comment. Tell us what you think of this article.
Share. Tell others.