

Ahead of the storm: How Australia benefits from global advances in cyclone forecasting
17 December 2014
Tropical cyclone forecasting has come an extremely long way in the four decades since cyclone Tracy – and Australia benefits from some of the best scientific and technological resources in the business.
When tropical cyclone Tracy made landfall on Christmas Day 1974, cyclone forecasting in Australia was a very different art. The Bureau’s meteorologists relied primarily on hand-drawn radar images, faxed or telexed from the nearest radar station and copied meticulously onto giant plotting maps. Satellite imagery was a brand new science—grainy black-and-white images with a resolution of 10 km were delivered every six hours from orbiting satellites, often tracked by a fearless technician balanced with a receiver dish on the roof.
.jpg)
WF44 weather radar image of cyclone Tracy on 24 December 1974
Today, the oceans around Australia are continually and intricately mapped by a series of highly sophisticated geostationary meteorological satellites (GMSs), which beam down a steady flow of digital imagery from a fixed spot 36 000 km above the equator. When Japan’s newest satellite, Himawari-8, comes online in 2015, it will deliver images the meteorologists of 1974 could only have dreamed of: composite 3D colour photographs of individual cloud formations, moisture levels and temperature variations—updated every 10 minutes, with spatial resolution down to an incredible 500 metres.
As one Japanese journalist observed, that’s the equivalent of being able to see an 11 mm pinball at a distance of 800 metres.
For cyclone specialists, the new systems represent a revolution in real-time forecasting. As well as delivering images at double the resolution and three times the frequency as its predecessor, Himawari-8’s cutting-edge imaging system carries discrete data on different weather elements on 16 ‘observation bands’—enabling much quicker detection of torrential rain, fast-growing cumulonimbus clouds and other early signs of cyclone formation.
‘These radical improvements in optics and imaging are delivering a sea change in satellite capabilities,’ says Ian Shepherd, Senior Meteorologist at the Bureau’s Northern Territory Regional Office. ‘As well as being able to find the location of low pressure systems, geostationary satellites can identify changes in cloud cover and structure, rain and wind speeds that point to a cyclone’s early formation. The newer orbiting satellites even have instruments that can accurately gauge wind speeds in a particular part of the ocean from solar radiation reflected off the waves.’
A global science
Although the tropical regions around Australia are highly vulnerable to cyclones—with an average of 11 forming between November and April each year—our geography also gives us some lucky breaks in forecasting. While Japan’s world-leading MTSAT satellites cover the entire Australian continent and the oceans to our north and west, China’s Feng Yun-2 satellites provide excellent coverage of the eastern Indian Ocean, where many of the cyclones impacting Western Australia originate.
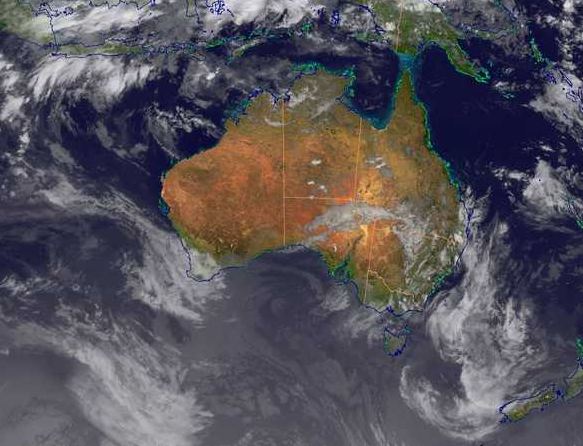
Satellite image courtesy of Japan Meteorological Agency
Since the time of Tracy, cyclone forecasting has grown into a uniquely collaborative science, with WMO-accredited Regional Specialised Meteorological Centres and Tropical Cyclone Warning Centres (including Darwin) sharing information across seven ‘cyclone basins’—from Africa and India, across Asia and the Pacific, to the United States. Whenever one of these centres issues a cyclone advisory, it instantly flashes around the globe, alerting every meteorological agency in its path.
Cyclone Tracy of course predated most of these developments. Regular images from geostationary satellites— the most potent weapon in the modern cyclone forecasting armoury—first became available in the late 1970s, following the 1975 launch of the United States’ first GOES satellite. The late ’70s also saw the arrival of the first ‘dynamical’ models for forecasting cyclones, combining powerful supercomputers with sophisticated numerical software and meteorological data to produce increasingly accurate ‘track maps’ of predicted cyclone paths.
However, it was not until the 1980s that satellite images began to reflect the ‘third dimension’ of storm systems—vertical profiles of temperature and moisture that allowed forecasters to more accurately gauge the location, size and intensity of storms. Since then, the art of cyclone forecasting has blossomed into a highly advanced science, with a wealth of ‘ensemble’ models comparing forecasts from various global models and combining them with regional satellite and radar data to create much more informed forecasts.
‘Modelling cyclone tracks for 3–4 days today is more accurate than it was for 1–2 days in the 1970s and ’80s,’ says Greg Holland, the veteran Bureau meteorologist who co-authored the first two editions of the Australian Tropical Cyclone Forecasting Manual—the original ‘bible’ for Australian forecasters. Indeed, some specialised forecasting tools, such as the Strike Probability Forecasts developed by the European Centre for Medium-range Weather Forecasts (ECMWF), demonstrate remarkable success in predicting cyclone positions up to five or six days in advance.
The Bureau’s cyclone forecasting is based on a ‘consensus’ of forecasts from about 14 models worldwide, including the ECMWF, Japan, UK, the US and three Australian models developed by the Centre for Australian Weather and Climate Research. Forecasters also keep a close eye on global atmospheric cycles such as the Madden–Julian Oscillation and the El Niño – Southern Oscillation, which can both influence and portend the development of cyclones in tropical waters. For example, Australia generally experiences fewer cyclones in El Niño years.
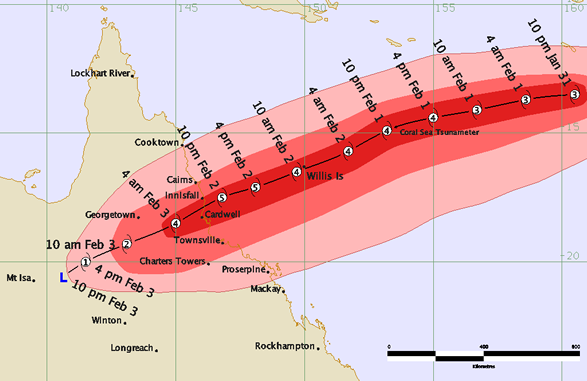
Severe Tropical Cyclone Yasi track map from 31 January - 3 February 2011
Every day during the cyclone season, our forecasters analyse these global models and incorporate those that demonstrate the greatest coherence and reliability into their own mapping software—together with a steady stream of data from satellites, radar, weather stations, and weather balloons. Early each morning, forecasters at the Tropical Cyclone Warning Centres (TCWCs) in Brisbane, Darwin and Perth run through an extensive series of checklists and analyses, documenting any weather systems or disturbances in their regions. This informs a daily Tropical Cyclone Outlook for each region, detailing any tropical depressions or cyclones with the potential to impact over the next three days.
When a low pressure system starts to show any of the signs associated with a cyclone, forecasters will begin to ramp up their monitoring, launching specialised tools to monitor cloud cover and wind speeds, and developing track maps of the system’s potential path over the next 5–7 days. ‘In the old days, our meteorologists would be marking the cyclone’s progress in pencil on a chart and then faxing it to areas facing a potential impact,’ says Alan Sharp, National Manager of the Bureau’s Severe Weather Services. ‘These days, with all our systems interlinked and information updated automatically, a lot of the hack work is done by the system—so our forecasters have much more time to look at the models.’
Warning bells
When a cyclone is active in Australian waters, but is not expected to impact land within 48 hours, a Tropical Cyclone Information Bulletin will be issued. If the system moves within 48 hours of the coast, this will be followed by a Tropical Cyclone Watch – which then becomes a Tropical Cyclone Warning 24 hours before landfall. Each of these messages is accompanied by a Forecast Track Map, with a track of the cyclone’s recent movement and broadening ‘cones’ representing its predicted path over the next 24, 48 and 72 hours.
As the cyclone intensifies, the Warning Centre enters into a fixed schedule of activation phases, each accompanied by a complex and rigorously maintained series of procedures and public advisories. Close liaison begins with local councils, police and emergency services. TV and radio stations are contacted. Specialised information is developed for mariners, maritime authorities, airports, coastal industries, and even – if necessary – neighbouring countries.
Once a cyclone begins to threaten a coastal population, the Bureau may start to issue hourly warning messages. The TCWC may also have to draft in more staff to increase their radar surveillance, monitor more data sources, and ensure the timely delivery of forecasts – online, through phone and fax messages, or directly to local media. If a Warning phase is declared, it is ‘all hands on deck’, as the Centre mobilises more resources and may switch to emergency operations – including backup phone lines, UHF radio, and generator power – if required.
As Australia learned to its cost on December 25th 1974, there are no greater weapons in the war on tropical cyclones than prior knowledge and early action.
More information
http://www.bom.gov.au/cyclone/
http://severe.worldweather.wmo.int/
http://www.bom.gov.au/australia/satellite/about_images.shtml
Comment. Tell us what you think of this article.
Share. Tell others.