
Models put the El Niño pedal to the metal—but does it mean anything?
26 May 2015
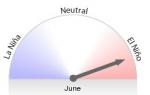
It takes a lot to make a Bureau climatologist go 'wow' these days, but on 18 May, there were a lot of 'wow's round the office. Our latest International Climate Model Summary was the warmest model update most of us had ever seen. Predicted ocean temperatures in the central Pacific for the southern spring 2015 are on average 2.4°C above normal—well past our +0.8°C threshold for El Niño (Figure 1).
But does such a high value actually mean anything?
And by that we're talking two things: Can we believe the models? And does this mean we’ll see stronger El Niño impacts in Australia?
Well in short; yes, it means we're very likely to see El Niño persist through 2015. Yes, it means that we are in a completely different ballpark to last year. And yes it means we should watch the models and oceans very closely over the coming months for further signs of continued vigorous warming.
But no, it doesn’t necessarily mean significantly greater impacts for Australia. And no, we can't say for sure (yet) that 2015 will be like other years with similar Pacific Ocean temperatures (e.g. 1982, 1997).

Figure 1: Summary of international model outlooks for El Niño (Niño34); dial range –2°C to +2°C
The models
Let's start with the slightly easier bit; the model summary itself.
The eight El Niño–Southern Oscillation (ENSO) models we survey from around the world were selected very carefully by the Bureau for several key elements: they must be updated every month; they must be produced by an operational service (not relying upon a single researcher); and must have accessible verification information. Many of these aspects are covered by them being accredited by the UN World Meteorological Organization as a Global Producing Center' (GPC) of Long Range Forecasts. These are indeed the bee’s knees of models.
These GPCs send us their data every month—it certainly isn’t our interpretation—and this means it is data that American, UK, European, Japanese, Canadian and French meteorological services (plus the Bureau) are happy to leave their door and go public. There is an immense amount of science, super-computing, data analysis (several million pieces of data go into each and every model), verification and indeed pride behind these three little numbers.
Although we know these models have ‘skill’—i.e., they’re demonstrably better than even a climatologist having an educated guess— this skill is not even through the year. There is a dip in the southern autumn called the ‘predictability barrier’ (see Figure 2.) That’s because this is the time of year when El Niños, and their sister La Niña, typically spawn or die, often because of random processes sitting atop the natural annual cycle of tropical Pacific Ocean temperatures. In the southern autumn, the temperatures along the equator naturally become more uniform, which effectively resets the ENSO clock.
But as we head into the southern winter, the skill (i.e. the increasing red bits on the plot) zooms up. In the space of one month, on average, we go from the lowest skill (note it isn’t no skill, just the lowest skill) to the highest skill. And that month is, of course, May. As in right now.
So the further we get into winter, the greater confidence we have that the models are going to give a more accurate outlook for the following spring.
Right now, in late May, we still can't be completely sure that the numbers are the real deal, but we can consider them a guide. As we move further into the southern winter, if models are still showing very high values then we will get greater and greater confidence that this could be a big event, such as a 1982 or 1997 in terms of strength.
But would a climatologist bet their bottom dollar on a big event as early as May? No. But they would be saying to watch this space carefully, because numbers over +2°C don’t come along very often, and the potential for a substantial event is there.
What the collection of models does tell us though, is that they are all very much on the same page. Normally there is a fair degree of difference in the model outlooks. For instance, this time last year they were also warming up, but at least three models were not that sure it would amount to anything. And indeed they were right.
This time we have far more warming too—at least double last year's numbers—and all models are emphatic about an event occurring. This, combined with the knowledge that they do have some skill at this time, tells us the odds of an El Niño continuing right through 2015 are currently very high.
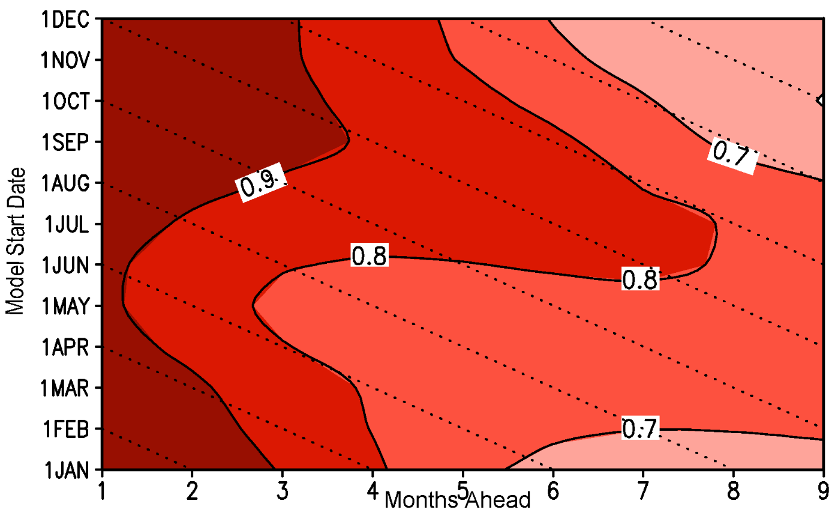
Figure 2: Skill of the model forecast for El Niño (Niño 3.4) ocean temperature, for time of year the outlook was made (vertical-axis) and how many months ahead the forecast is (horizontal-axis). The skill measure is the anomaly correlation coefficient between the model forecast and the subsequent observation. In simplest terms, the closer the score is to 1, the better the model has performed in the past
The impacts
The second 'does it mean anything' is ‘does this mean anything for the outlook for Australian rainfall, temperature, snow, frost, heatwaves, drought, tropical cyclones, etc. and the subsequent grain crop and pasture growth, dust storm potential, fire risk, mosquito numbers, coral bleaching, and even spots on mangoes, damaged bananas, and the quality of the 2015 red wine vintage?’
The answer is… maybe.
Not every El Niño brings drought. Of the 26 El Niños since 1900, 17 were associated with widespread droughts in Australia. And even if conditions are poor, low rainfall doesn’t mean no rainfall; rain at the right time can mean a successful harvest. Check out our list of El Niño and their impacts.
But the real message is that you can get low rainfall in a weak El Niño (e.g. 2006) or a strong El Niño (e.g. 1982). In part this is because once your rainfall gets low, it can be hard for it to get much lower. Or to way oversimplify things, you can't get negative rainfall.
But we've also seen reasonable rain at times in both strong (1997) and weak (1969) El Niños too.
So for Australia at least, a strong event doesn’t automatically mean strong impacts. But all El Niño have seen some drying in at least some areas, so managing the risk for dry and warm, and associated drought and fire, is essential in any El Niño event.
And remember, El Niño isn’t the only thing that affects our climate. As we can see right now with a wet April in many southern (normally El Niño impacted) areas, Indian Ocean temperatures also play a key role in our Australian climate, especially earlier in the year. Plus there are the local sea surface temperatures, soil dryness, Southern Ocean conditions, Antarctic sea ice, and even events much further afield that have primary, secondary and tertiary impacts upon our weather and climate. That’s why no two El Niños are the same. It's not like every other driver of our climate shuts down during an El Niño winter and takes a nice, warm, European vacation.
For many other places around the globe though—especially those that see wetter conditions in an El Niño such as California, western South America, and South Pacific nations near the equator—a stronger event can mean stronger impacts. For them, it's far more important to gauge the strength as early as possible.
We do know that El Niño is a natural part of Australia's highly variable climate. And we do know that climate model outlooks are the best tools we have ever had for managing our climate risk.
To stay up to date with ENSO developments, visit our website or subscribe to our ENSO Wrap-up email.
References
- Anthony G. Barnston, Michael K. Tippett, Michelle L. L'Heureux, Shuhua Li, and David G. DeWitt, 2012: Skill of Real-Time Seasonal ENSO Model Predictions during 2002–11: Is Our Capability Increasing? Bull. Amer. Meteor. Soc., 93, 631–651. doi
- Mei Zhao and Harry H. Hendon, 2009: Representation and prediction of the Indian Ocean dipole in the POAMA seasonal forecast model. Q. J. R. Meteorol. Soc. 135: 337–352 (2009)
Comment. Tell us what you think of this article.
Share. Tell others.