The radar guys: The end of an era at the Bureau’s Radar Group
15 July 2015
When you next check the rainfall on the Bureau’s online radar, spare a thought for five men who have kept Australia up to speed with the latest radar technologies since 1979.
When Frank Cummings retires from the Bureau of Meteorology on 15 July 2015, it will draw a line under a career that has seen radar emerge from the shadows of wartime secrecy to become one of modern meteorology's most powerful tools.
Frank, 63, is the longest serving of five unsung veterans who between them have dedicated nearly a century and a half to the Bureau’s Active Remote Sensing group—previously known as the Radar Group.
Since Frank joined the Bureau in 1979, radar has grown from a relatively obscure science to become one of Australia's top ten online services.
Frank's retirement follows that of radar systems commissioner Harvey Edwards, who worked in the Radar Group for 31 years, and purchaser Richard Endacott, who retired in 2012 after 28 years. When fellow commissioner Dave Shaw hangs up his hat next year after 25 years, it will leave developer Ray Jones, a veteran of 27 years, as the last remaining member of the original team.
'It's a bit of a family affair here,' quips Frank, 'and I suppose we are in the midst of a bit of a generational change!'
In the last generation, the five colleagues have gone from watching (and hand-tracing) black-and-white displays in a darkened room, to sophisticated digital systems that capture and compare 3D images from multiple locations and relay them directly to users online. Where once these images would have taken several hours to reach the public, they can now be seen on a mobile screen within seconds.
A regional revolution
|
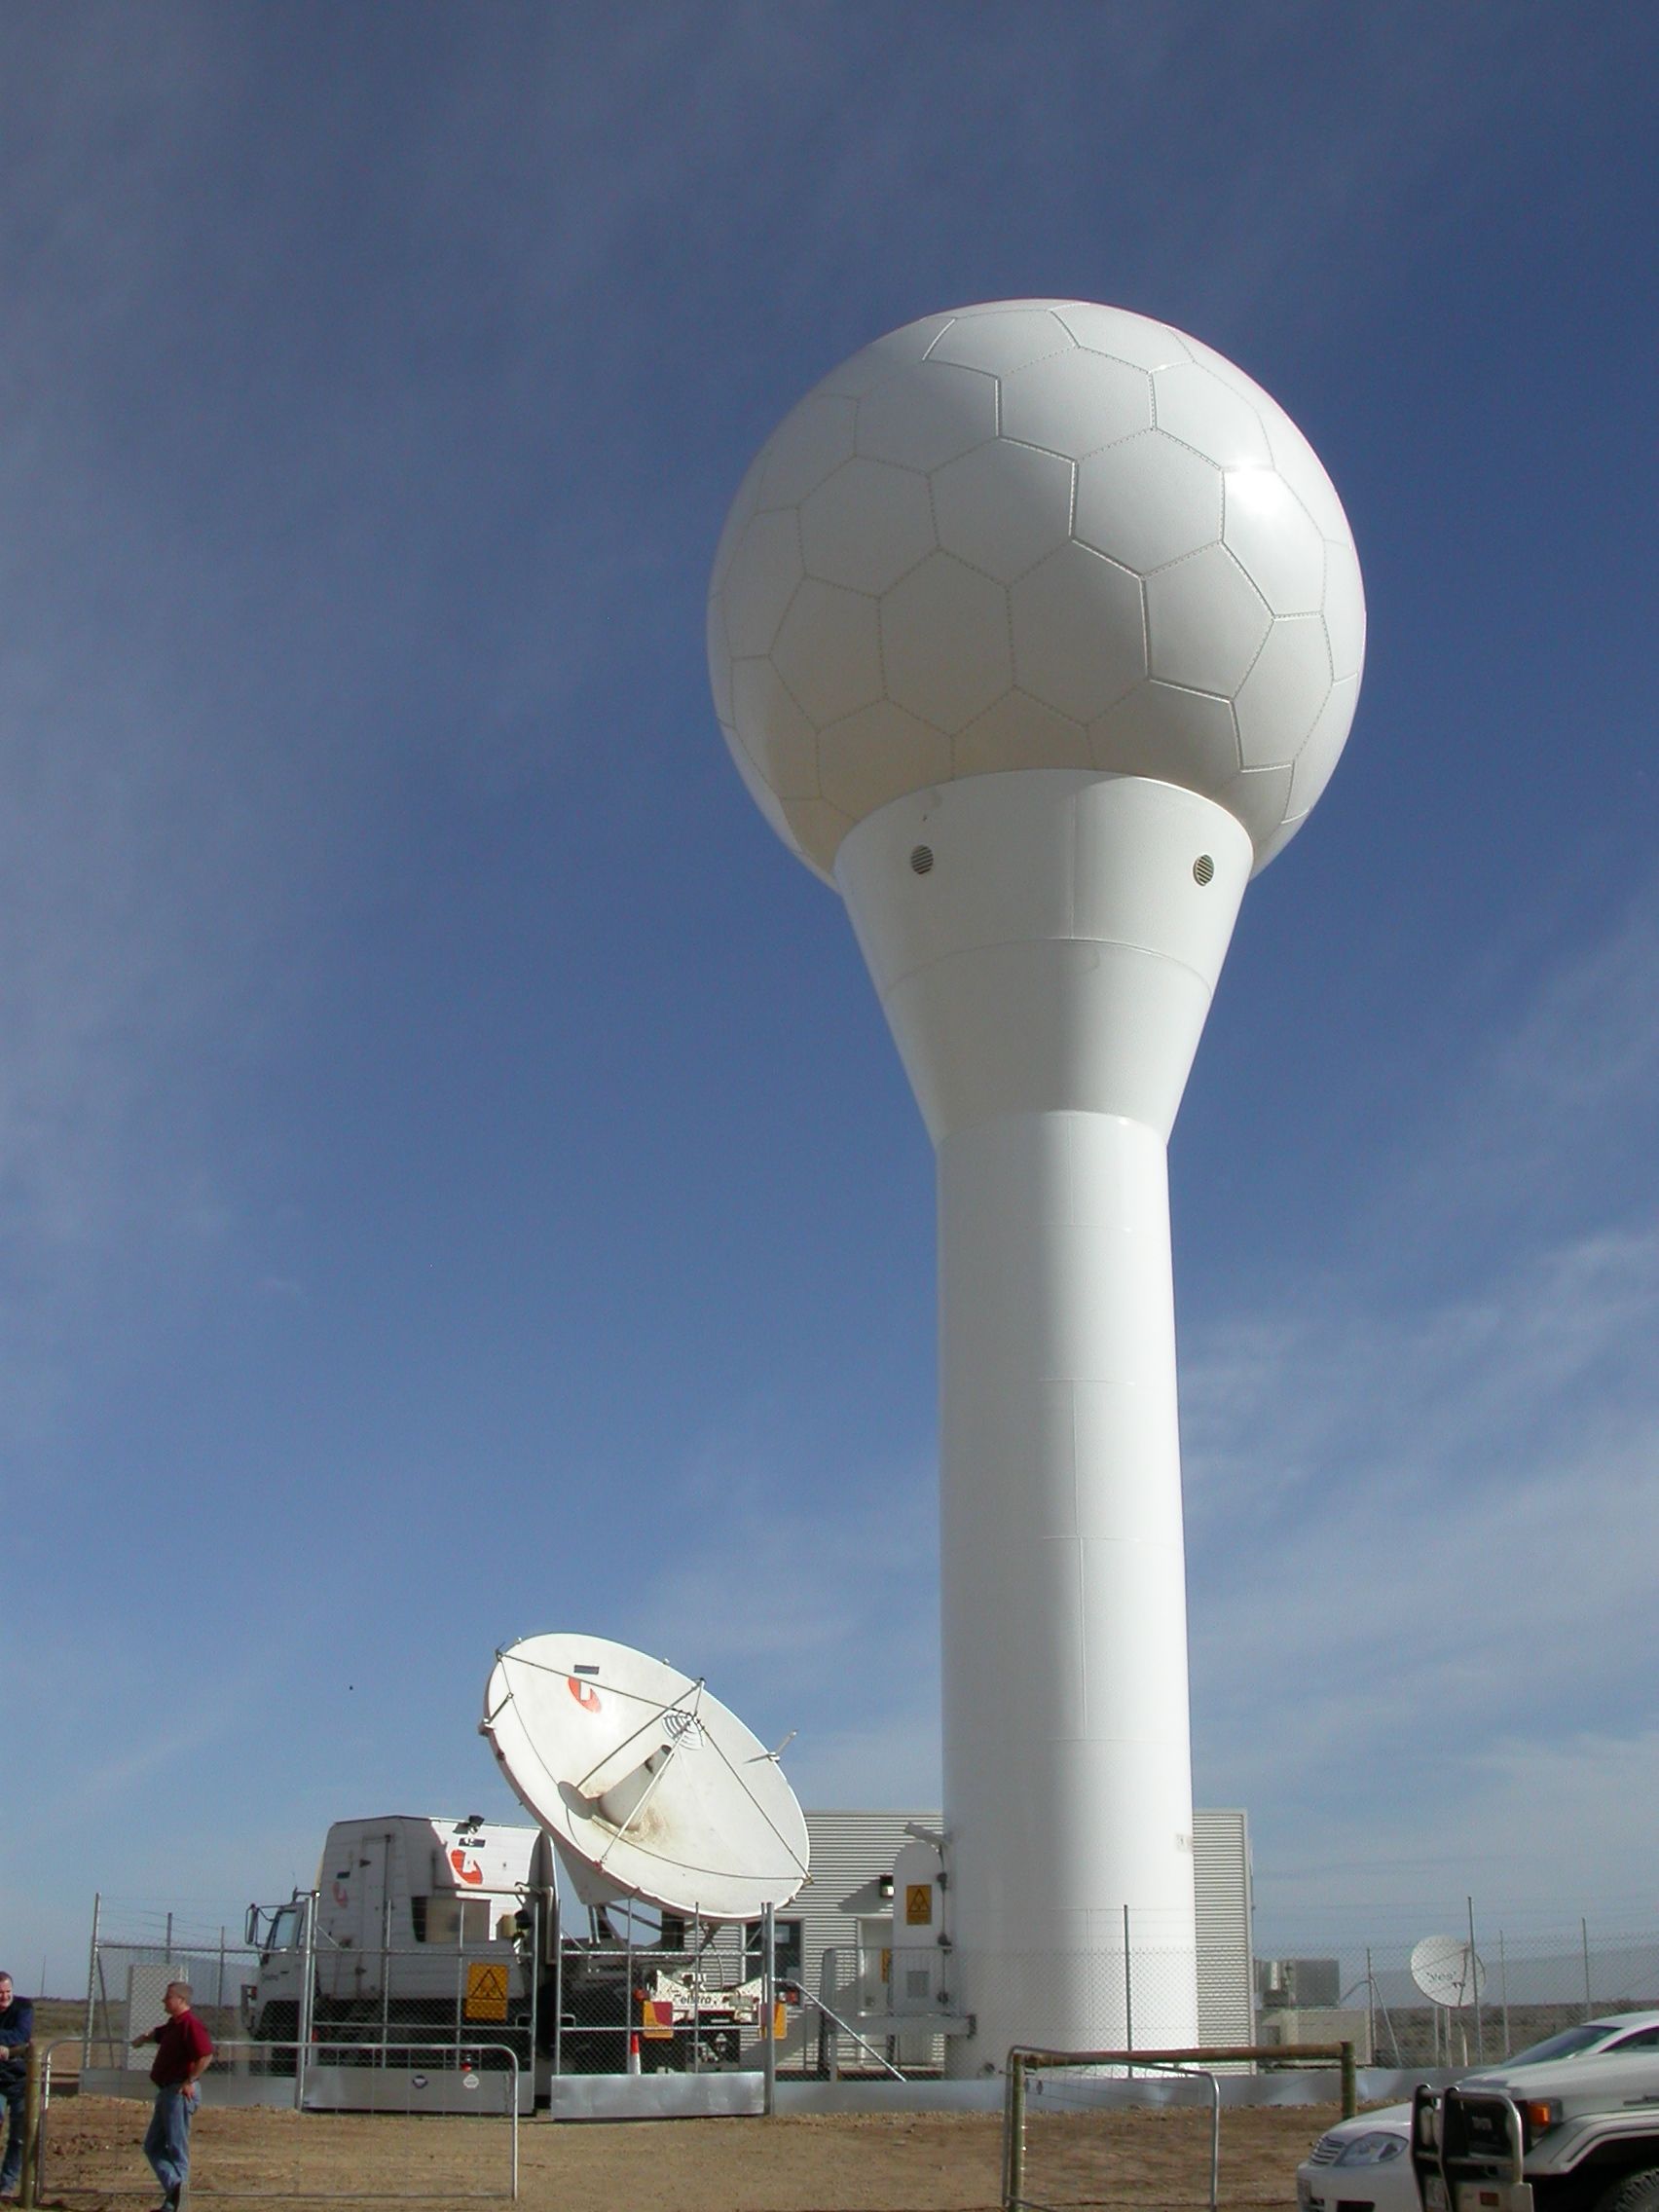
Adelaide S-band radar, 2005 |
Throughout the 1980s and 90s, Frank Cummings and Harvey Edwards respectively headed up the development and commissioning of weather watch radars at the Bureau, contributing to at least 50 new radars in Australia—and a similar number in neighbouring countries. Although both are modest men, Harvey fondly recalls the 'single-minded brilliance' of Frank Cummings, whose technical ingenuity helped the Bureau to design and build some of the most reliable radar technologies of their time. |
|
These technologies included:
|
 |
Today, the veterans can reel off the milestone developments as if they were yesterday: the first PC-based displays, the first time-lapse sequences, the 'resolution revolution' that accompanied digital signal processing. And more recently, the arrival of Doppler technology and its unique capacity to measure how fast rainstorms are moving, and the 'dual-polarisation' technology that enables radars to emit both horizontal and vertical radio waves—significantly improving the detail and accuracy of rain forecasts.
Harvey remembers a particular challenge that 'weighed heavily' on the group—to animate the radar images in the memories of their RAPIC Receivers so that forecasters could study the progression of storm systems. The goal was to show 16 images at a rate of one per second—but the Bureau's first Apple computer wasn't powerful enough to convert the radar images, acquired at a rotating angle, into a format that could be read on its monitor, which draws them from left to right.
'We were debating the problem for ages, and then Frank came up with a simple but ingenious solution,' recalls Harvey. That solution involved a 'polar-rectangular conversion' that, embedded in a pre-calculated lookup table, enabled the computer to convert a circular radar image onto a lineal screen in 0.7 s. 'It was so ingenious,' says Harvey, 'that three years later, the US manufacturer of a similar technology actually thought we had stolen their intellectual property!'
Radar comes of age
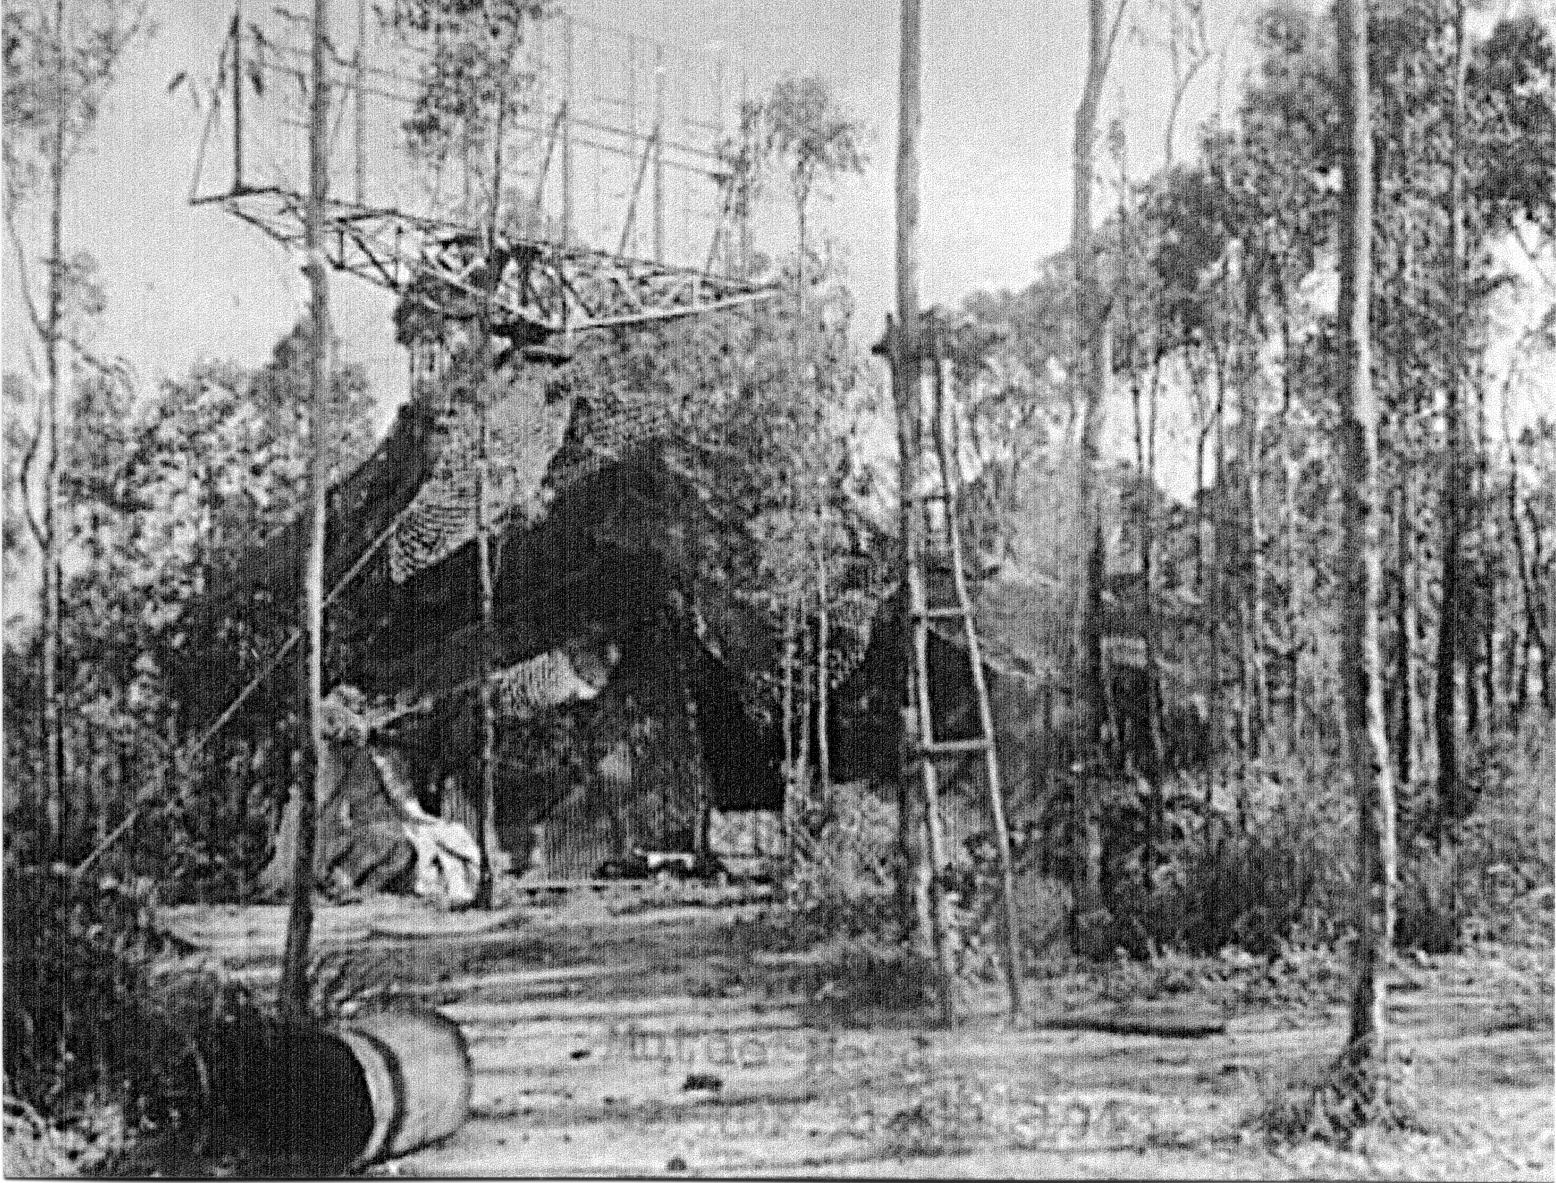
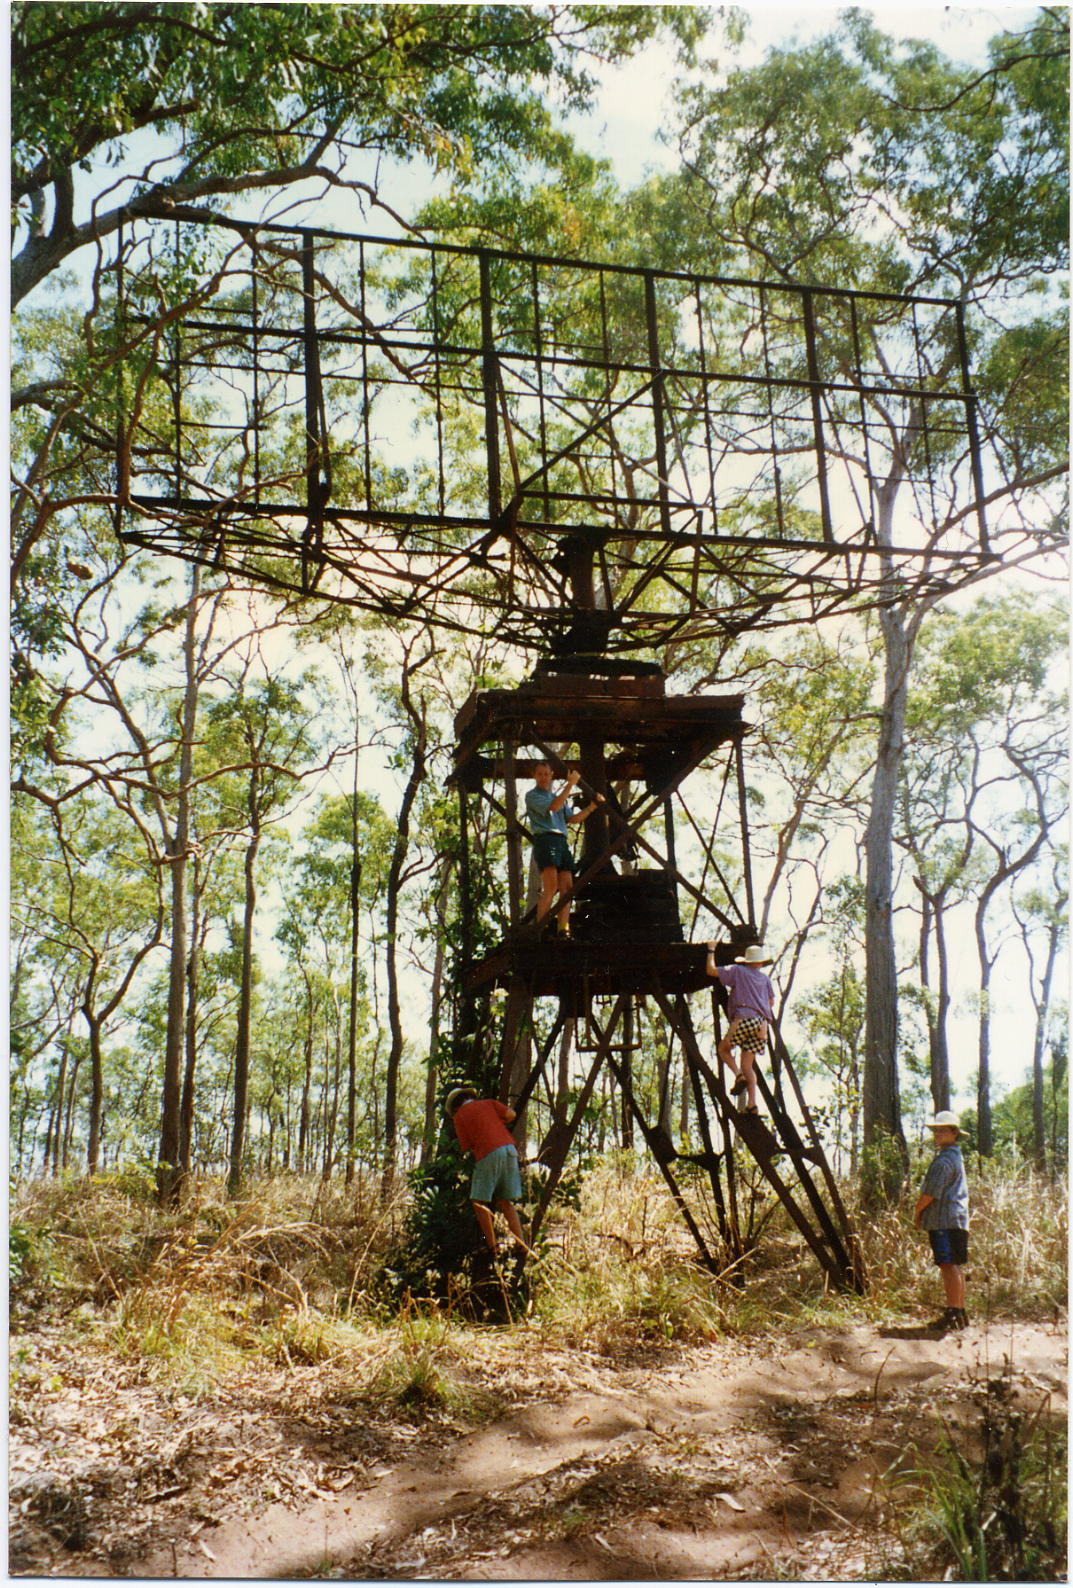
In the late 70s, when Frank and Harvey joined the Radar Group, Australian systems had not progressed much beyond the low-frequency radar and cathode-ray displays developed during the Second World War. But this changed rapidly during the 1980s and 90s, as the advent of personal computers, Doppler radar and 3D technologies enabled forecasters for the first time to see inside storms and rain clouds.
|
No. 52 Radar Station RAAF at Muttee Head, Queensland, 1943. |
Frank Cummings and family at Muttee Head radar, mid-1990s |
Through the 1980s, the military-style radars of old were gradually replaced, and in the 90s back-up radars and Doppler technology began to arrive in the state capitals. By the mid-1990s, the Internet and mobile phones were in widespread use.
'In a generation, we came from a world where forecasters were receiving hand-drawn radar images by fax, to a world where everyone expected to see how the rain is moving, at this instant, on their mobile phones,' says Harvey.
For Australia, facing the challenge of covering an enormous territory with limited taxpayer funding, the challenge was always to extract the highest resolution data from the Bureau’s radars at the greatest frequency. This was a realm where Frank arguably had no equals. As the Radar Group's chief 'techie', he was responsible for designing new control and tracking systems that enabled the Bureau’s older radars to 'talk' to new PC-based displays and forecasting systems—significantly extending their operational life, and saving millions of dollars in the process.
But though Frank Cummings was often the technical brains, the great achievement of the Radar Group was the tireless dedication and determination of a cohesive group of specialists brought together by the Bureau's visionary Head of Radar, Alf West.
'There was always this incredible passion in the group,' recalls Harvey Edwards. 'I used to go into our Abbotsford office on the weekends to do a few hours of work undisturbed—but I soon had to give up on that idea. There were always two or three other guys in there on weekends, and until 9 pm or later on weekdays.'
The result of all that hard work is a radar network that, despite financial constraints, continues to keep pace with the best in the world. Today, Australian radars can 'see' echoes from rain clouds up to 3.5 km high and out to approximately 200 km, with resolution down to an incredible 0.25 km. The expansion of high-resolution Doppler technology continues to improve our capacity to monitor the density and movement of rain at different altitudes, providing vital data for forecasting cyclones and thunderstorms—as well as the squalls and showers that affect our daily lives.
|
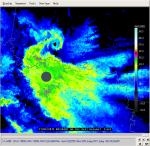
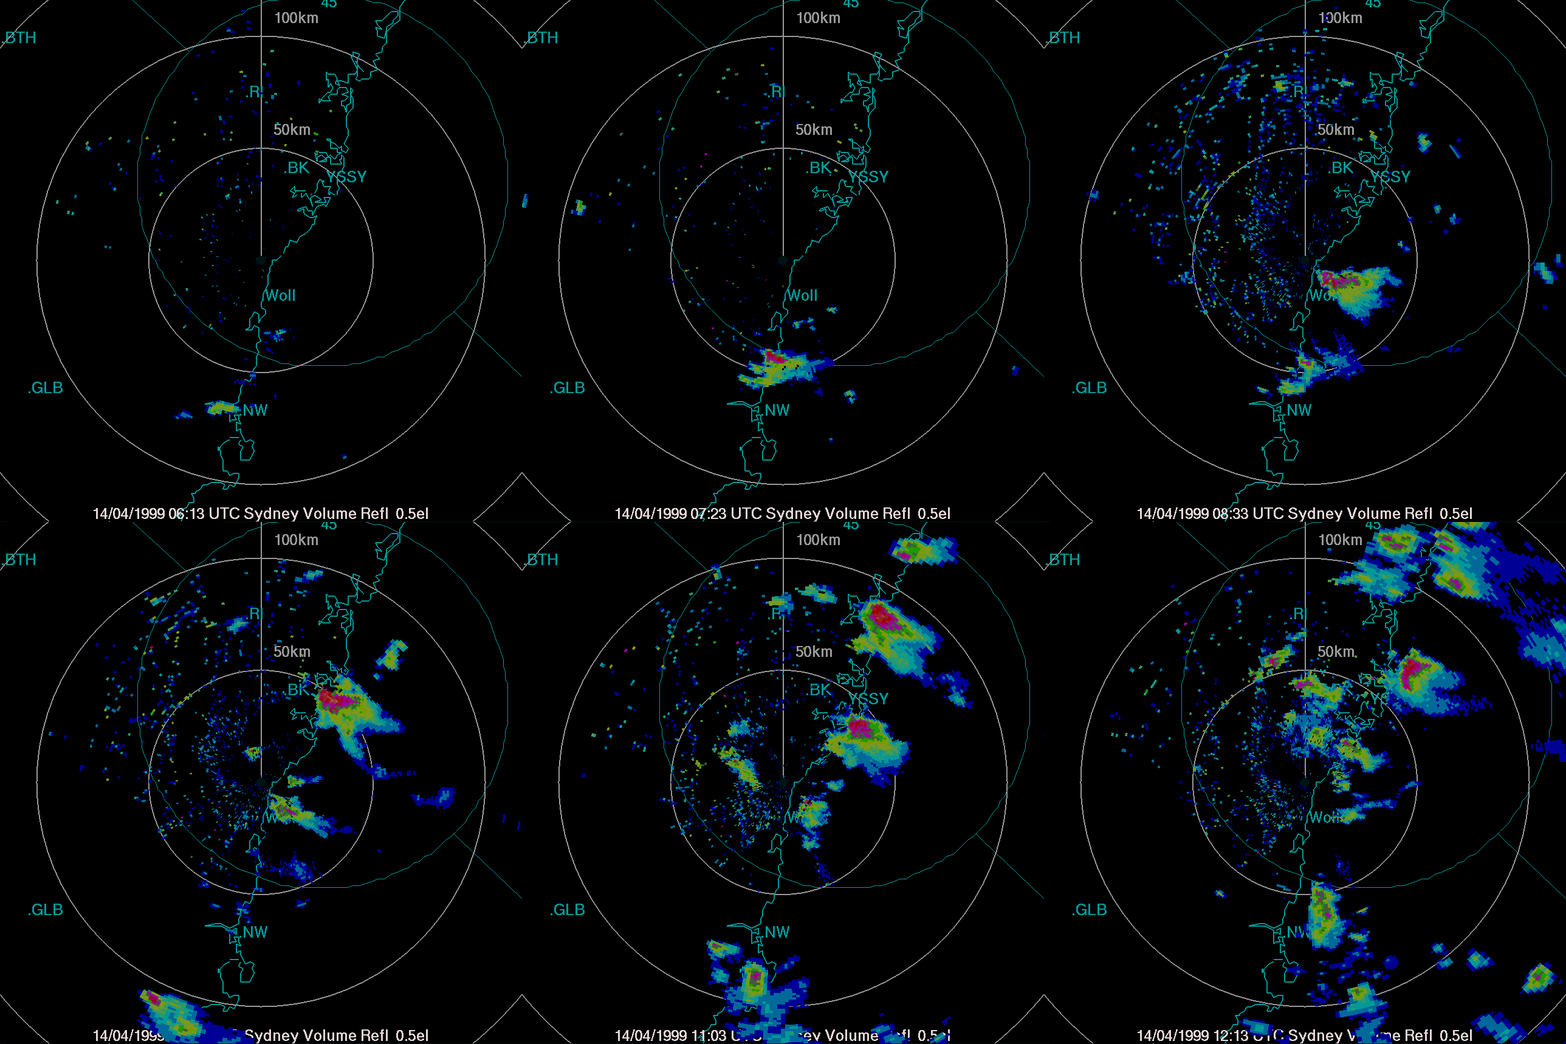
The radar guys naturally have a few stories to tell about how 'their' radars have contributed to some of the most important weather data of recent times. Frank recalls the prescient timing of the Kurnell Doppler radar south of Sydney, which within weeks of its installation was reporting the 'supercell' hailstorm that pounded the city on 14 April 1999—causing over $2 billion of damage. Its unique dataset of 'cyclonic vortices' remains the definitive record of the genesis of Australia's costliest natural disaster. |
Radar loop of Sydney hailstorm, 14 April 1999. |
'It's something worth knowing if you're in a pub quiz team,' says Frank. 'Everyone usually thinks that cyclone Tracy was the costliest, but no—it was that incredible hailstorm that swept up the Sydney coast, wiping the roofs off nearly every house in its path.'
More information
Real-time radar forecasts: www.bom.gov.au/australia/radar
Information on the capacity of individual radars: www.bom.gov.au/australia/radar/about/radar_coverage_national.shtml
Information on radar maps, locations and how radar works: www.bom.gov.au/australia/radar/about/index.shtml

Comment. Tell us what you think of this article.
Share. Tell others.