
On a roll: MetEye adds new swell maps and wave forecasts to skippers’ planning toolbox
14 September 2015
Three new features on the Bureau’s map-based weather viewer provide a comprehensive voyage planning service for Australian boat skippers.
Any mariner worth his salt in Australia knows just how dangerous our coastal waters can be. We’ve all heard stories of how a sudden squall or rough seas have wrecked an afternoon’s fishing trip or put a sailing crew in peril. Too often, the tragic results wash up on the evening news.
So skippers around the country who have been painstakingly analysing the Bureau’s wind and wave forecasts will be pleased to see an expansion of our interactive, map-based weather viewer that lifts voyage planning to a new level.
From September 2015, MetEye will provide discrete information on the height and direction of different swell conditions—as well as wind waves and total wave height.
Thanks to the time-tested reliability of our NexGen forecast and warning system, you’ll be able to see how these specific features are expected to evolve at three-hour intervals over the coming days in any 6 x 6 km grid square off Australia’s coast. To safeguard this reliability, our meteorologists are continually monitoring and assessing the wave forecasts against the actual conditions.
Playing the weather forwards
MetEye has long provided an important planning tool for sailors, with its graphical representation of the wind speed and direction at different points along a voyage—and the ability to ‘play the weather forwards’ over several days on an animated map.
But until now, the state of the sea has retained much of its mystery; MetEye has offered only a general overview of the 'combined sea and swell'—an indicative figure for total wave height that combines the height of the seas and swells.
All that will change with the addition of three exciting new features that detail the height of local wind waves (or 'sea waves') and the height and direction of two separate swell trains. The latter is particularly important for mariners off Australia's east coast, where the confluence of the Pacific and Southern Oceans often generates swells from different directions.
The new MetEye wave forecasts will enable skippers and crews to study how different swells and wind waves are likely to affect their vessels at different times along their voyage. They will help you determine whether you’ll be facing a rolling swell or choppy sea—or a combination of the two—and to evaluate the capability of your craft to safely navigate these conditions.
Tracking two swells
While there is usually a single dominant swell affecting the coast, sometimes two or more swells are generated by different weather systems, which can make wave conditions less predictable.
The new MetEye maps can indicate two separate swells—'Swell1' and 'Swell2'. These are differentiated by their direction, rather than their size or dominance, so Swell1 may not always be the biggest. It’s important that skippers and their crew check both swell options when planning their trip.
The Swell1 and Swell2 maps display swell wave heights in metres, represented by coloured shading, for the start of each three-hour time period. The swell direction is indicated by arrows for each grid point.
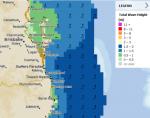
On the 'Total wave height' map, the arrow directions of one or both swells are displayed. If there is only one swell, the arrow will show a single direction. If a significant second swell is also expected in the area, a second, shorter arrow will be displayed. This provides a quick view of the overall wave conditions for skippers, and acts as a reminder to check the individual swell and wind wave maps.
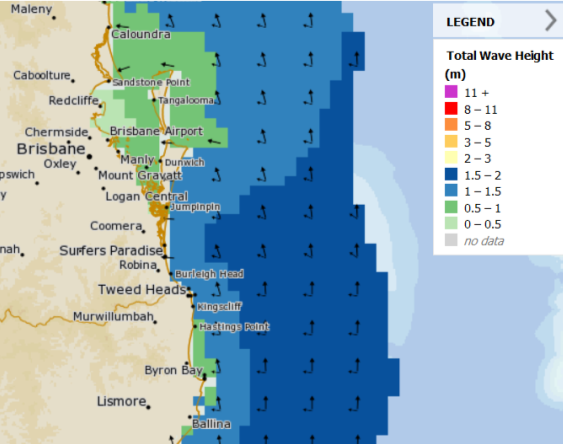
‘Total wave height’ map showing a combination of a larger southerly swell (the larger arrows) interacting with a smaller easterly swell (the smaller arrows) off the southern Queensland coast.
Wind wave heights
MetEye’s new 'Wind wave height' maps present wave heights with different coloured coding for the start of each three-hour time period. Wind waves are also referred to as ‘sea waves’ in other formats of the Bureau’s marine forecasts. 'Chop' is another commonly used term for wind waves.
Although the wind wave maps do not have direction arrows, the wind waves are caused by the winds blowing at the time and are usually moving in the same direction as the wind.
Used in conjunction with our marine text forecasts and warnings, MetEye swell and wave maps add another safety dimension to your journey planning. Waves are an important component of the 'Five vital weather safety checks' to do before you go boating.
More information
MetEye: www.bom.gov.au/australia/meteye
Marine and ocean services: www.bom.gov.au/marine
Important note:
Please be aware that maximum wave heights may be up to twice the significant wave heights presented on MetEye. This applies to the Total wave height, Swell1, Swell2, and Wind wave height maps.
Comment. Tell us what you think of this article.
Share. Tell others.