
How does a weather radar work?
09 June 2017
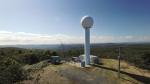
Jutting above the landscape like a giant golf ball on a tee, a weather radar uses radio waves to detect rain (and sometimes wind) in the area around it. So, what’s really going on inside the ‘golf ball’ and how do radars work?
Australia has the fourth-largest weather radar network in the world, with more than 60 radars. Radars are generally located in areas that are prone to high-impact weather—such as tropical cyclones or thunderstorms—that might affect large populations or areas of economic investment such as agricultural or mining areas.
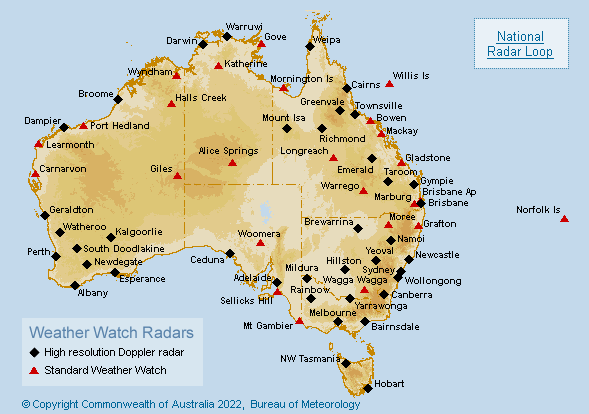
Image: Australia’s radar network
How the radar works
The word ‘radar’ is an acronym for ‘radio detection and ranging’ and is a technology based on radio waves.
A weather radar detects precipitation, such as rain or hail. Inside the radar’s distinctive white sphere is a rotating dish (or antenna) that sends out radio waves in short pulses. When these pulses hit water particles they reflect back to the radar as ‘echoes’, much like the echoes of sound you hear in a cave or tunnel. The time it takes for the pulse to return tells us how far away the rain is, while the strength of the return signal reveals the type of precipitation.
The antenna rotates once every 20 seconds, but because we must scan both at low levels (for rainfall) and at higher altitudes (for preparing severe weather warnings) we take 14 'sweeps' of increasing elevation above the horizon. The radar images on our website are composites of the lowest four sweeps in a set, to reduce some of the problems with blocking and echoes from hills (see below).
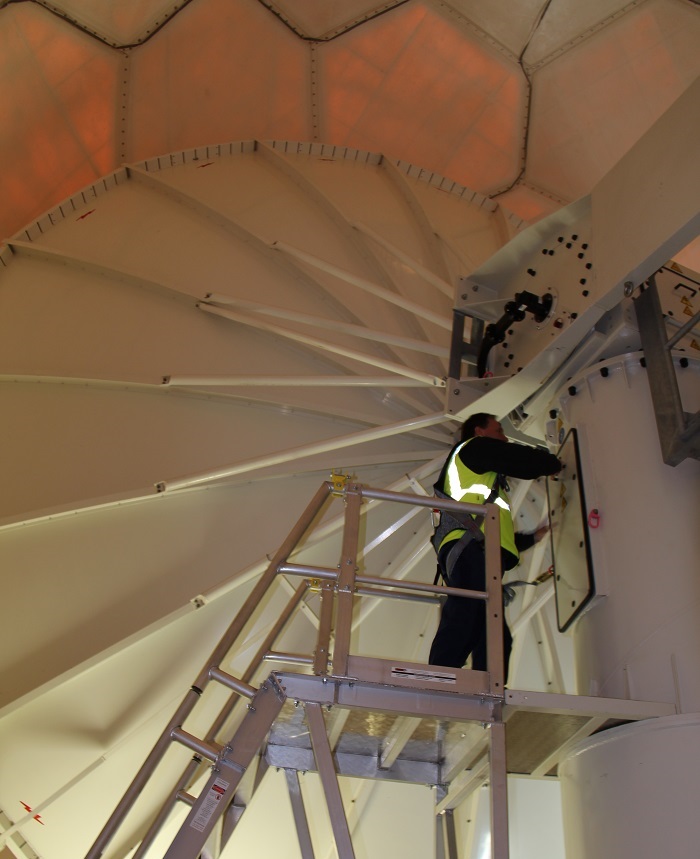
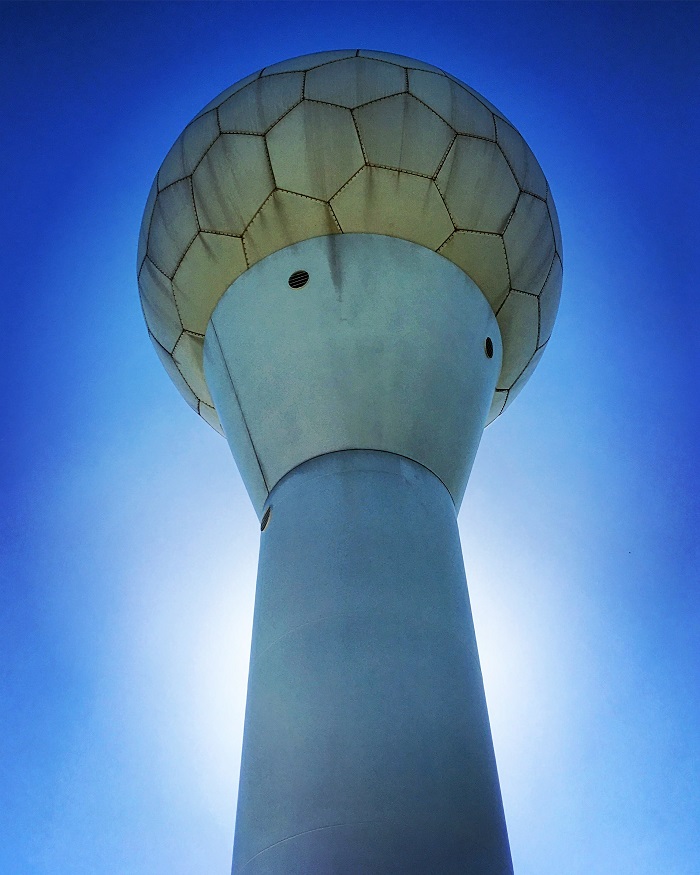
Image: Under the radar: a technician works beneath the radar’s circular dish (left); looking up at Melbourne’s Laverton radar (right).
What’s on the radar image?
This information is converted into data on a map that can be viewed on the radar pages of our website or the BOM Weather app. A colour scale is used to indicate the intensity of the rain—with black being the heaviest rain, sometimes indicating hail.
A new image is displayed every 6–10 minutes, and these form a 30-minute loop. It’s important to note that this isn't a forecast: it shows you where the rain has been, so you can infer where it might go next.
The time on the bottom of every radar image is displayed as UTC/Greenwich Mean Time, so that if you’re viewing a radar in one time zone and move to one in a different time zone, you know you're looking at the same time. On our website, local time is displayed next to the radar.
You can choose whether to see certain features (locations, topography, lakes and rivers etc.) on the radar map. Select your preferred features from the ‘map features’ box at the bottom right of the screen.
Some radars also show wind speed and whether the wind is moving towards or away from the radar—these are known as Doppler radars.
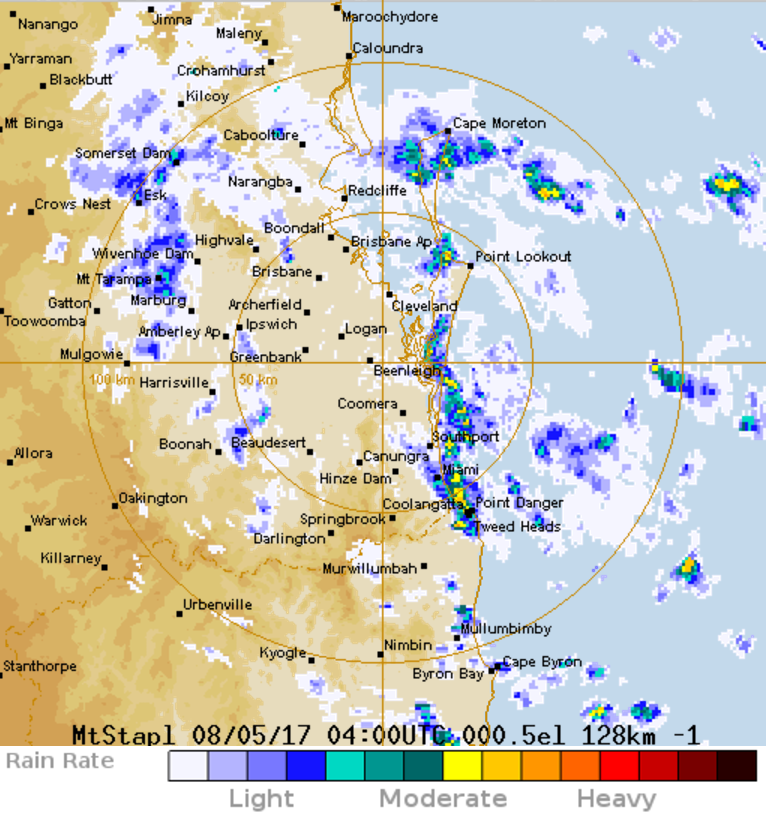
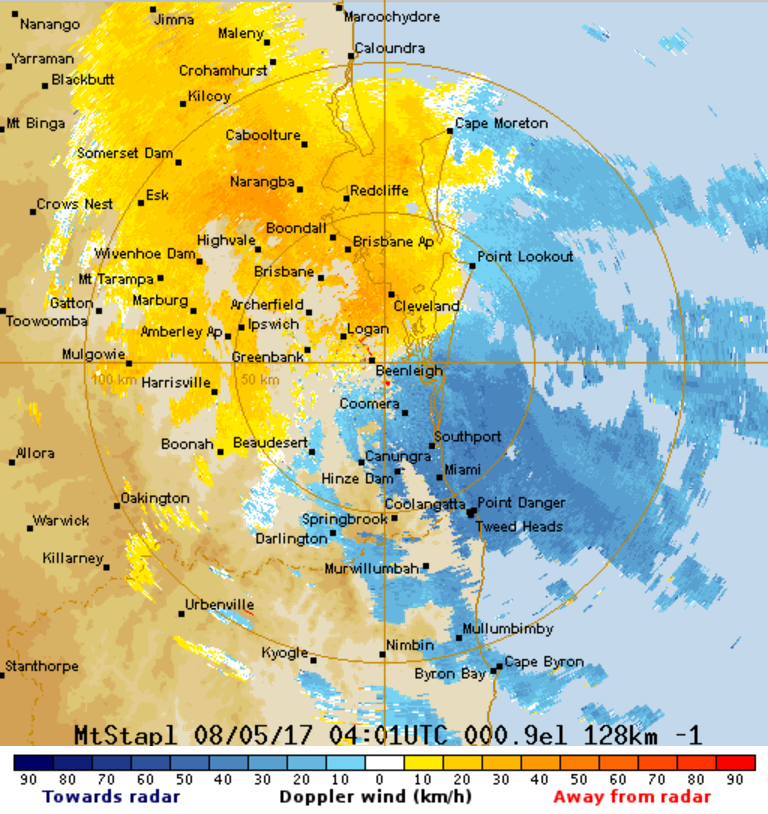
Image: The radar (left) shows where rain has fallen in a 30-minute loop. A Doppler radar (right) shows wind speed.
In range: what the radar can (and can’t) detect
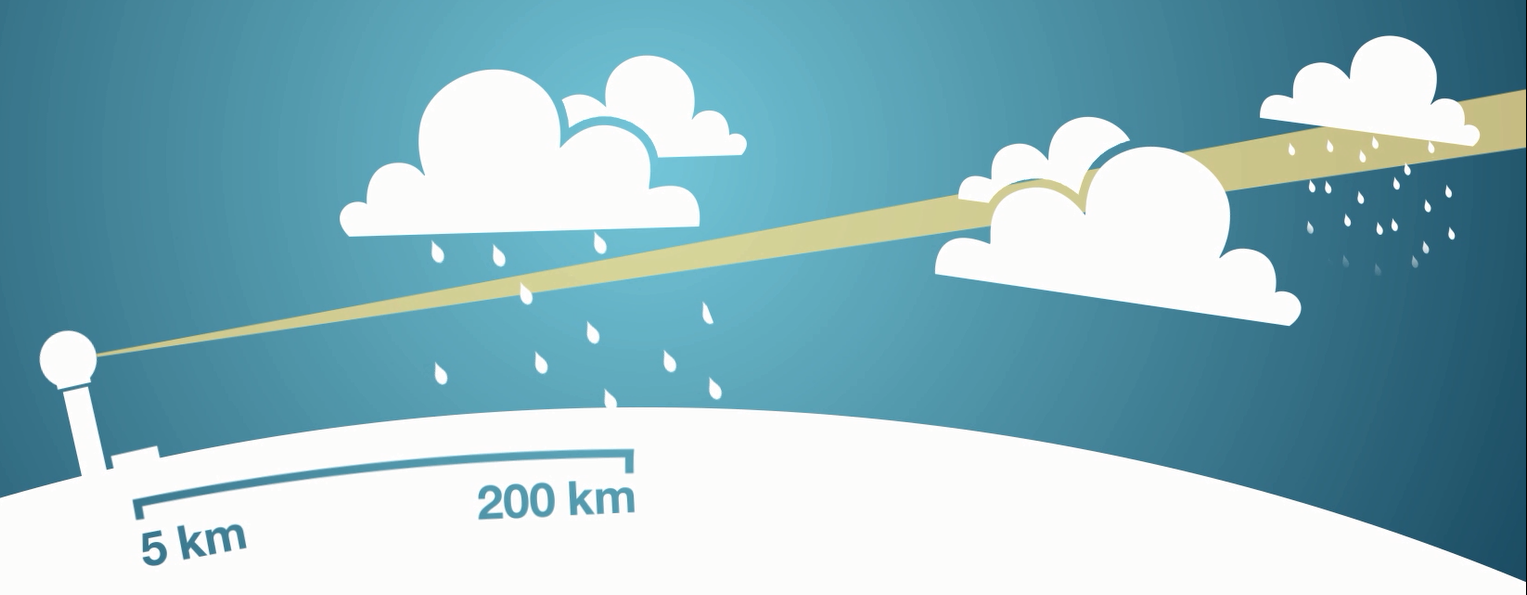
There are some limitations to radars. The curvature of the Earth means that the radar beam’s optimal range is 5–200 km. Beyond 200 km, the radar might be showing rain that’s falling high in the atmosphere and this might not reflect what is happening on the ground.
Even inside the optimal range, radars can sometimes detect ‘virga’—rain that’s falling, but evaporating before it reaches the ground. That's why sometimes the radar may appear to show rain when it’s not raining at ground level.
Low-level drizzle is also hard for the radar to detect because the droplets are so small and form close to the ground—it literally ‘flies under the radar’.
There are usually no echoes displayed very close to the radar because the radar doesn’t scan directly above itself. This is known as the ‘cone of silence’.
Fooling the radar: seeing things that aren’t rain
The radar may sometimes detect faint echoes from material other than rain—such as aircraft, smoke/ash from large fires, swarms of insects or flocks of birds. Weather radars can even receive echoes from the Earth’s surface, which meteorologists call ‘anomalous propagation’. This happens when high pressure in the atmosphere causes an inversion: a layer in the atmosphere where the air gets warmer rather than cooler with height. The layer of denser, cooler air beneath the inversion can bend the radar beam down to the ground (or ocean) and back to the radar. We’re usually able to filter reflections of the ground out of radar images, as their lack of movement gives them away, but reflections of the moving sea are more difficult to spot and remove.
If you're in doubt, try comparing the radar image to the corresponding photo from our satellite viewer—if there's no cloud in the area, a strong signal on the radar image is more likely to be anomalous propagation than heavy rain.
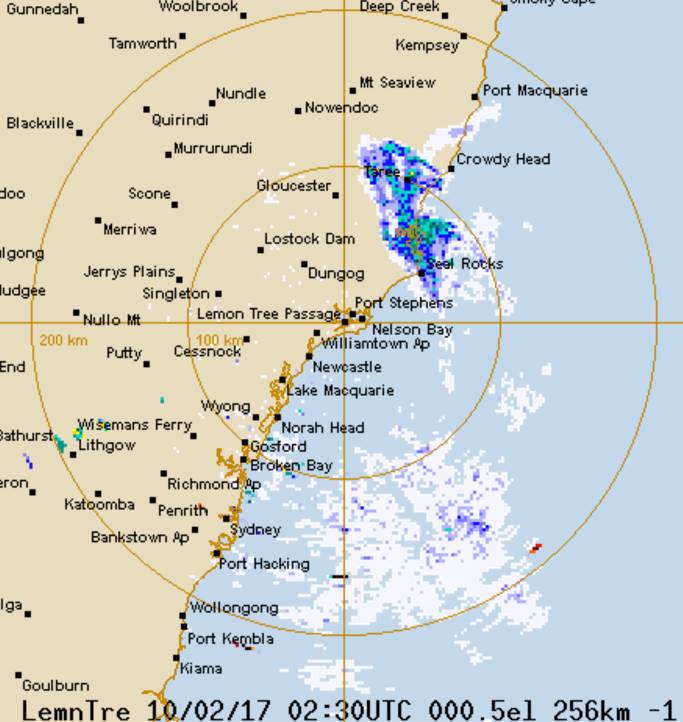
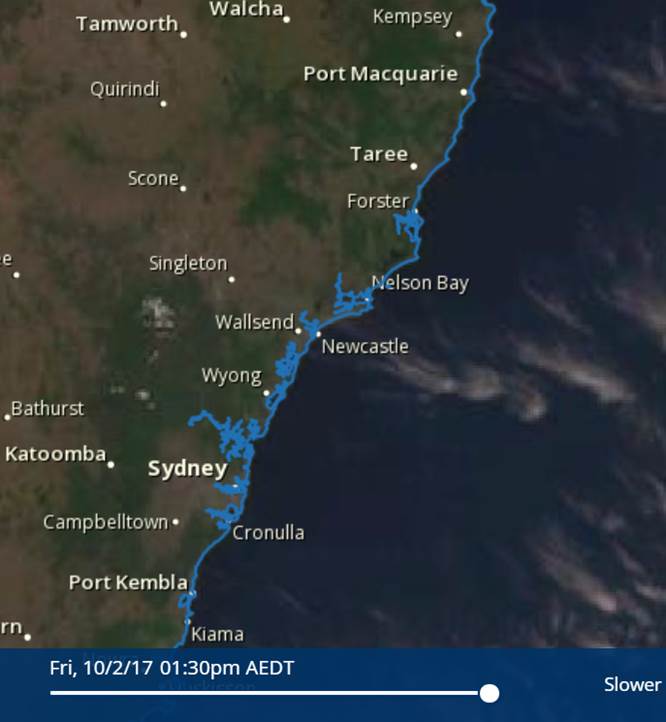
Image: Radar (left) and satellite (right) images of NSW coast 10 February 2017
Something else that looks like rain on the radar—in fact it's deliberately designed to fool radars—is 'chaff'. This is a shower of very thin aluminium fibres released during military air training exercises as a radar countermeasure. The echoes from the chaff create a 'cloak of radar invisibility' for the aircraft.
Near sunrise and sunset, the radar momentarily scans the sun. On occasion this can be seen as a distinctive line radiating out from the centre of the image in the direction of the sun.
Permanent echoes are created when the radar beam reflects off ground features and buildings, normally within about 20 km of the radar site, but mountain ranges further away can sometimes generate them too. We filter this 'ground clutter' out of the final radar image but selecting a radar location that minimises these echoes is important.
Radio transmissions can also interfere with our radars, and be mistaken for echoes from radar pulses. These usually appear as straight lines pointing towards a radar.
You may occasionally see other activity on the radar map that doesn’t look like rain. This takes various forms but is centred on the radar and caused by interference from other sources of radio waves—which could include Wi-Fi, mobile phone tower signals and other radars—and is also sometimes seen when radars are being repaired or serviced.
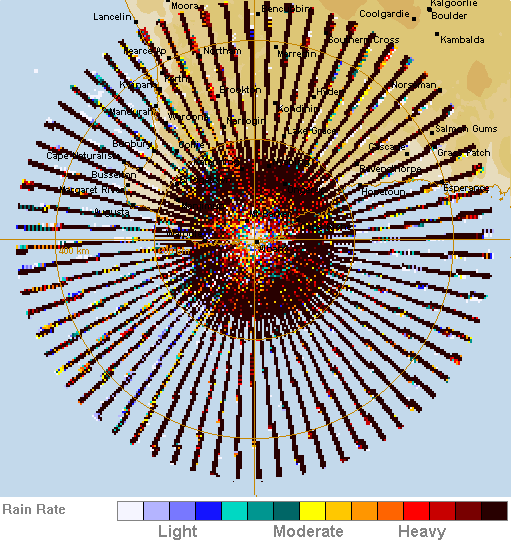
Image: Interference on the Albany radar, 13 January 2016.
Are weather radars dangerous?
No—because they use a beam that's angled up into the sky and is constantly moving.
Using the radar
The radar is just one tool you can use to observe current weather. It should be used in combination with other Bureau services, such as observations (find them under your State or Territory menu on our website), satellite images, forecasts and warnings. And if there’s a warning in place but you can’t see anything on the radar, always follow the warning.
More information
Improving Australia's radar and observation network

Comment. Tell us what you think of this article.
Share. Tell others.