

Explainer: How bushfire smoke can affect UV levels
24 January 2018
Updated 2 January 2020
From time to time, eagle-eyed viewers notice blobs on our UV forecast maps, showing colours quite different from those around them. Often these are caused by bushfire smoke, which can absorb and reflect incoming radiation, reducing the UV predicted for the day ahead.
UV and smoke: how does it work?
Ultraviolet (UV) radiation is a type of energy produced by the sun—a higher-energy version of the visible light we see. The sun emits three bands of energy: UVA, UVB and UVC. The stratosphere blocks all UVC radiation, most UVB but none of the UVA radiation. Therefore both UVA and UVB are of interest for human health. They contribute to skin damage, premature ageing, and skin cancer.
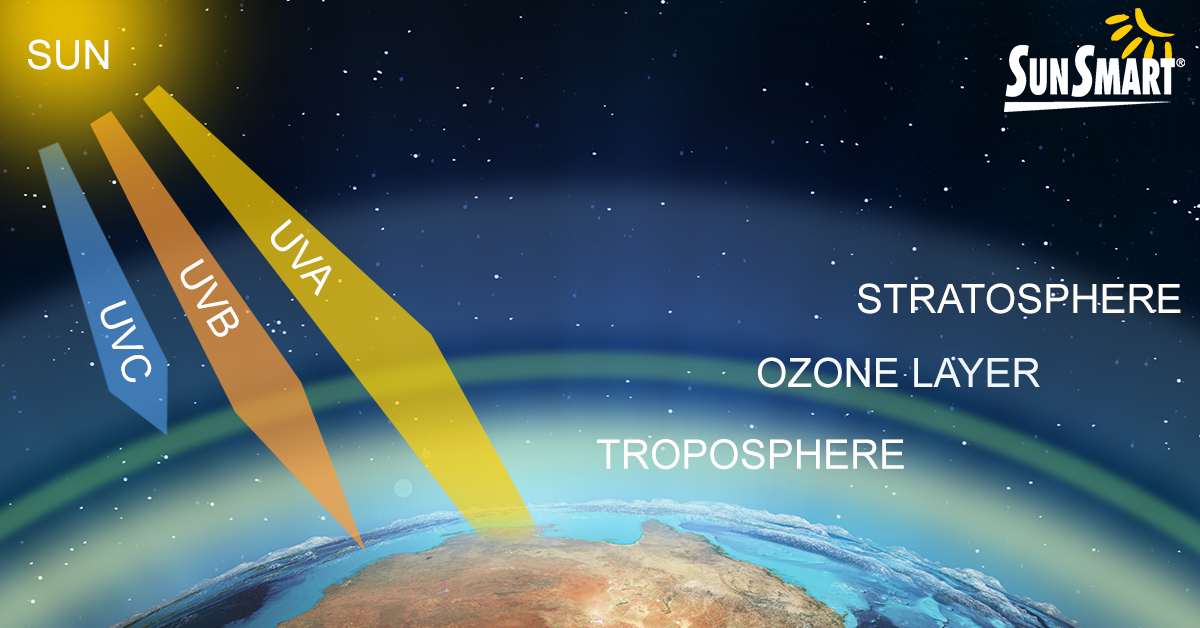
Image courtesy of SunSmart
Bushfire smoke and dust storms can cause elevated particle levels in the atmosphere. These small particles can scatter or absorb UV and reduce overall UV levels. Usually the reduction is only a few per cent, but in higher concentrations, more than 50 per cent of UV radiation can be absorbed.
The thicker the smoke or dust, the greater the reduction in UV tends to be. However, very importantly, UV can still be harmful despite the reduced levels, particularly during the height of summer when many bushfires occur.
A computer model is used to forecast the UV radiation at ground level. It takes into account information on the time of day, the sun angle, and actual and forecast ozone concentrations.
As part of the model processes, highly detailed satellite images are scanned automatically to identify fire hot spots. If these are found to be significant this will trigger the smoke plume model in the UV forecasts. The smoke plume is then spread by the forecast winds in the lower levels of the atmosphere to produce the effect on UV shown in the examples below.
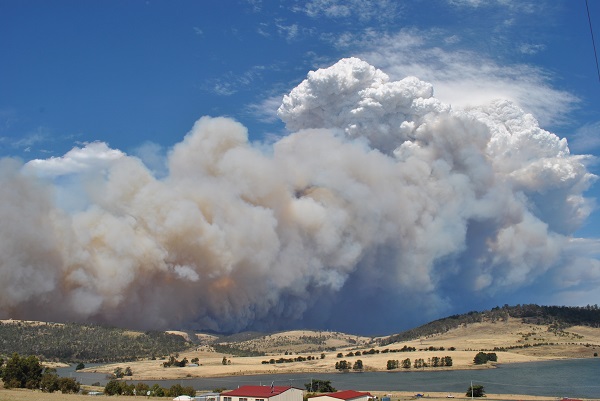
Image: Thick smoke, such as that seen at the Forcett fire in Tasmania, in January 2013, can reduce the amount of UV we are exposed to. Credit: Karen Dutton
Let's see it in action
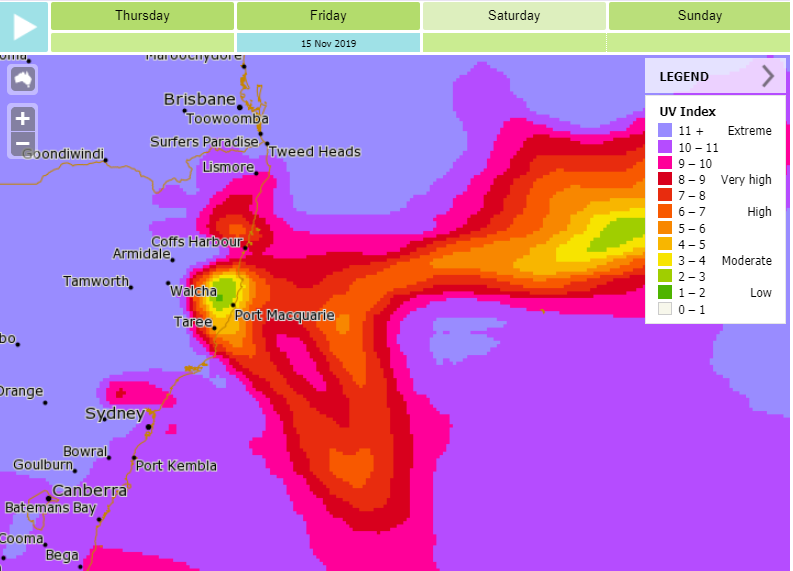
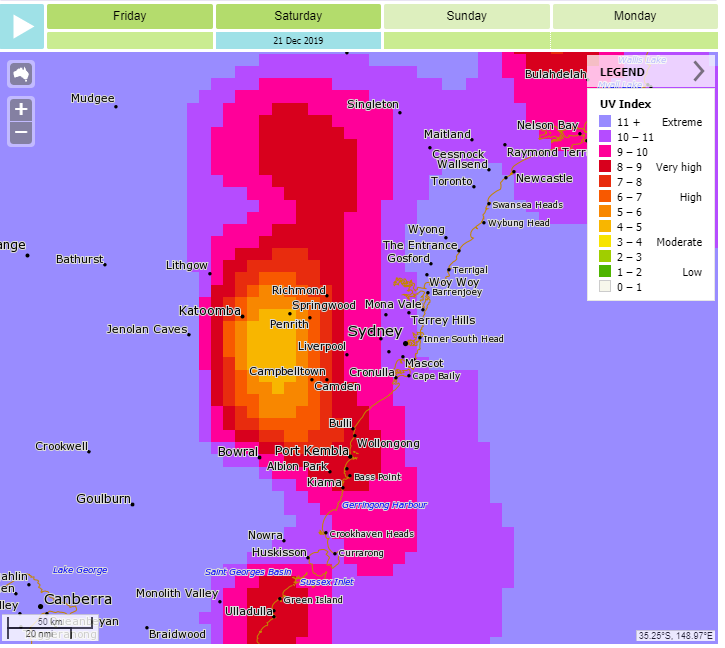
The maps below are from MetEye—the online mapping tool for displaying forecasts of UV and other weather elements. (Find out how to use MetEye here.)
In November 2019 widespread bushfires in northern NSW produced large volumes of smoke and significant smoke haze—reducing the UV forecast for that area and out to sea.
Large fires in December 2019 produced a similar effect on the UV forecast in Sydney and the surrounding area.
What other factors influence the amount of UV reaching us?
- Air pollution: Urban smog can reduce the amount of UV by reflecting UV back towards space or absorbing it.
- Altitude: The air is thinner and usually cleaner at higher altitudes over mountains. With less absorbing atmosphere available, more UV reaches the Earth's surface.
- Cloud cover: Cloud cover, especially thick unbroken clouds and rainfall can reduce UV, as thick clouds reflect and absorb more UV than thin cloud cover. However, the sides of clouds can also reflect UV and increase the amount of UV at the Earth's surface.
- Latitude: The most intense radiation is found when the sun is directly overhead so this is at the equator in the spring and autumn, at the Tropic of Cancer in the northern hemisphere summer and at the Tropic of Capricorn in the southern hemisphere summer.
- Ozone: Less ozone in the atmosphere leads to higher UV levels, and vice versa.
- Time of day: On any day the greatest amount of UV reaches the Earth around midday when the sun is at its highest point. When the sun is low in the sky, solar energy must travel a greater distance through the atmosphere and more UV is scattered and absorbed.
- Time of year: UV changes throughout the year. The highest levels are in summer months, and lowest levels in winter months.
More information
- Map and text forecasts of UV for Australia and its coastal waters.
- Real-time UV readings from the Australian Radiation Protection and Nuclear Safety Agency (ARPANSA).
- SunSmart advice on sun protection information.
- Five sun safety tips
- Fire weather knowledge centre
- Smoke and air quality information

Comment. Tell us what you think of this article.
Share. Tell others.