Explainer: weather models
29 March 2019
Updated 10 May 2023
It’s no exaggeration to say weather models have revolutionised weather forecasting in the modern era. And they’re getting smarter all the time. So what are they, how do they work and what can they tell us about our dynamic weather and climate?
What is a weather model?
Weather models are the main tool we use to forecast weather. They're also a key tool to research the processes that drive weather and climate. The models, run on computers, are also known as numerical weather prediction (or NWP) models. They create a virtual planet Earth, simulating the atmosphere, ocean, land surface and sea ice, and use mathematical equations to predict future weather.
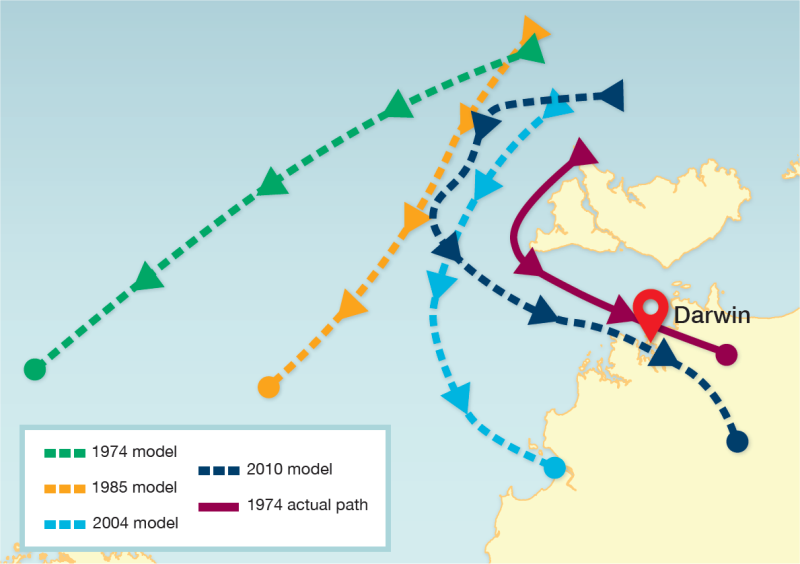
Weather models have revolutionised the science of weather prediction. Improvements in models, and a vast increase in the observation data that feeds them, have made a huge difference. They're a big part of why our 5-day forecasts today are about as accurate as a 3-day forecast in the early 2000s. The map below shows how weather models between 1974 and 2010 would have forecast the path of severe tropical cyclone Tracy. They come closer and closer to the path it actually took.

How do they work?
Weather models carve up the atmosphere into a large number of grid boxes, vertically and horizontally. We take what we know about the weather now – readings from all levels of the atmosphere and under the ocean known as 'observations' – and feed it in. As the models step forward in time, the temperature, humidity and wind in each grid box are updated by calculating heat, moisture and momentum (wind) transfer into and out of the grid box. This takes into account the way the atmosphere interacts with the ocean and land surfaces, such as sunlight heating the ocean and snow cooling the land.
Many processes in the atmosphere (such as thunderstorms and clouds) happen at scales much smaller than the size of the grid boxes. These physical processes are an important part of a weather model. We approximate them in each grid box using extra equations.
Video: Short animation illustrating the concept of how weather models divide the Earth into grid boxes.
Models take all the mathematical equations that explain the physics of the atmosphere. They then calculate them at hundreds of millions of points around the Earth. It's an enormous job. That's why models need vast computing power to complete their calculations in a reasonable amount of time. This means they must use some of the most powerful supercomputers in the world. Our supercomputer can handle more than 1600 trillion calculations per second.
We don't just run the equations once either. Under some circumstances we run them multiple times, each with slightly different starting conditions. This is called ensemble forecasting. It tells us whether small changes in the atmosphere or ocean are likely to cause a change in the forecast.
To calculate long-range forecasts we run them 99 times. If most of the runs come out with the same result, for example a wetter- or drier-than-average season, then the odds are higher for that outcome. If the model runs show a range of outcomes – some suggest wetter and some drier – then there's no strong signal one way or the other. This means there's a roughly equal chance of wetter or drier conditions.
What can they tell us?
The models can help us predict weather and ocean behaviour from time scales of hours to days to weeks to seasons. They can also help us with prediction and trajectory of severe events. For example, tropical cyclones, rainfall and flooding, ocean waves and tsunamis.
We also use models in research. They can increase our understanding of:
- the physical processes that drive weather and climate
- the role played by interactions between the atmosphere and elements such as land, oceans and ice.
Models can also help us understand the changes we are seeing in our climate over time. Estimating the relative contributions of natural variability and climate change to past extreme events such as record-breaking heat is one way of investigating this. It's done by retro-modelling the weather systems that caused the heat, but with less CO2 in the environment than there was at the time. You can then see how that changes the outcome.
What does the future hold?
Scientists are working all the time to make weather models more accurate. Basically, this boils down to:
- being able to input better data about current conditions such as temperature, humidity and air pressure at the start of the process
- increasing the model resolution to give more detailed information
- adding more interactions between the different systems, such as modelling the atmosphere and ocean together.
Increasing the model resolution means that each of the grid boxes that the atmosphere is divided into is smaller. This allows greater detail in the modelling. It's like the difference between looking at a road map at the regional level, showing highways and main roads, and zooming into your town or suburb, with every street showing.
The resolution in forecast models is always improving. Our current global weather forecasting model has 12 km grid squares. Our model for short-range forecasting over the Australian region has grid squares 1.5 km wide. Our scientists are working to develop city-scale models with 300 m grid squares that will become the weather models of the future.
When the models are calculated at a more detailed level, forecasts overall become more accurate. Our ability to forecast things that happen at a very local level should also improve. For instance, fog that may affect airports, or thunderstorms. This kind of weather is influenced by the local details at the surface, as well as the larger-scale weather patterns. An example of a local detail is the shape of the terrain.
Of course, all that adds up to more and more equations, so being able to run the improved models depends upon enough computing power being available to crunch the numbers.

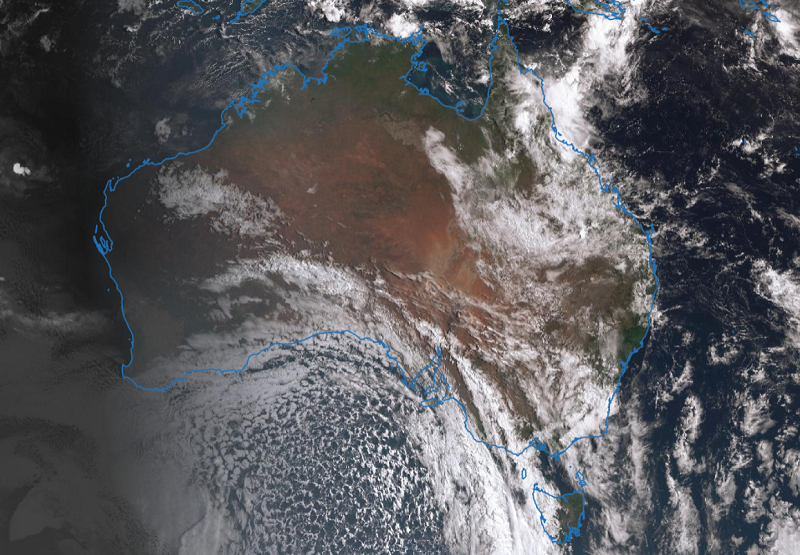
Image: Australia, seen from the Japan Meteorological Agency's Himawari satellite. In the southern hemisphere, satellites are a key source of the observations that feed into weather models.
Working with multiple models
Australia has its own weather and climate model, developed by the Bureau and CSIRO. It's called the Australian Community Climate and Earth System Simulator ('ACCESS' for short) and is based on the UK Met Office's Unified Model. But there are several other models around the world that we also look at when making weather and climate forecasts. These include models from meteorological agencies in Japan, the US, France and Canada. There's also one that's a collaboration between more than 30 European nations (called ECMWF).
Models around the world have common elements. But they also differ, particularly in the extra equations they use for the smaller-scale weather processes. It's useful to watch models from other regions as well as our own. If more models are showing a particular outcome we can have greater confidence in the likelihood that it will happen. For example, a developing low-pressure system that may form into a tropical cyclone. When we blend the output of the various models, the results are more accurate than any single model. This is also relevant for predicting climate drivers such as the El Niño–Southern Oscillation and the Indian Ocean Dipole. For these, we provide an average of international models as part of our own outlook.


Comment. Tell us what you think of this article.
Share. Tell others.