
Annual Climate Statement 2020: Australia's fourth-warmest year on record
08 January 2021
The Annual Climate Statement shows 2020 was Australia's fourth-warmest year on record. For the country as a whole, rainfall was close to average but there was considerable variation between regions. The year had its fair share of severe weather. It began with much of the country in drought, and with record bushfire weather and smoke. This was soon followed by flooding. But it wasn't as extreme as 2019, which was Australia's hottest and driest year on record.
For 2020, the national rainfall total was 483.4 mm, 4% above the 1961–1990 average of 466.0 mm. Australia's area-averaged mean temperature for 2020 was 1.15 °C above the 1961–1990 average.
Globally, 2020 will be among the top 3 warmest years on record despite there being a La Niña. This typically keeps global temperatures cooler than during neutral or El Niño periods.
Video: Watch this short video to understand Australia's climate in 2020.
Weather events of the year
The year began with significant multi-year rainfall deficiencies (longer-term drought) across much of Australia. This followed generally below-average rainfall over much of the country for the previous 3 years. A return to more normal rainfall quenched some of the short-term deficiencies during the first half of the year. However, the multi-year deficiencies have proven harder to shift. Despite some recovery in much of the east of the country, in Western Australia large areas received very little rain during April to July. Short-term rainfall deficiencies emerged across much of the southwest from April.
High temperatures, a dry landscape, and strong winds combined to produce dangerous fire weather conditions across southeast Australia in January. Smoke haze from bushfires extended across Victoria, the Australian Capital Territory, and New South Wales at times through January and into February.
Heavy rainfall produced major flooding in Queensland and New South Wales in February, and again in Queensland during March. An increase in monsoonal activity in December brought heavy rainfall and flooding to the Pilbara and Kimberley areas in Western Australia. A coastal trough and slow-moving low pressure system brought severe weather and flooding to parts of northeast New South Wales and southeast Queensland.
Extreme heat affected northern Australia at times during August. Some stations in northern Western Australia broke their previous August record multiple times. Significant heatwaves affected parts of Australia several times during November. These included much of northwest to southeast Queensland around the middle of the month. Towards the end of the month it was the turn of much of southeast and eastern Australia. Extreme heat continued into the first days of December.
Fourth-warmest year on record for Australia
The annual mean temperature is a combination of the maximum and minimum temperatures. For Australia in 2020 this was 1.15 °C warmer than average and the fourth warmest on record. Annual mean temperatures were very much warmer than average for the majority of Australia. But they were close to average for much of eastern South Australia, southwest New South Wales, and western Victoria.
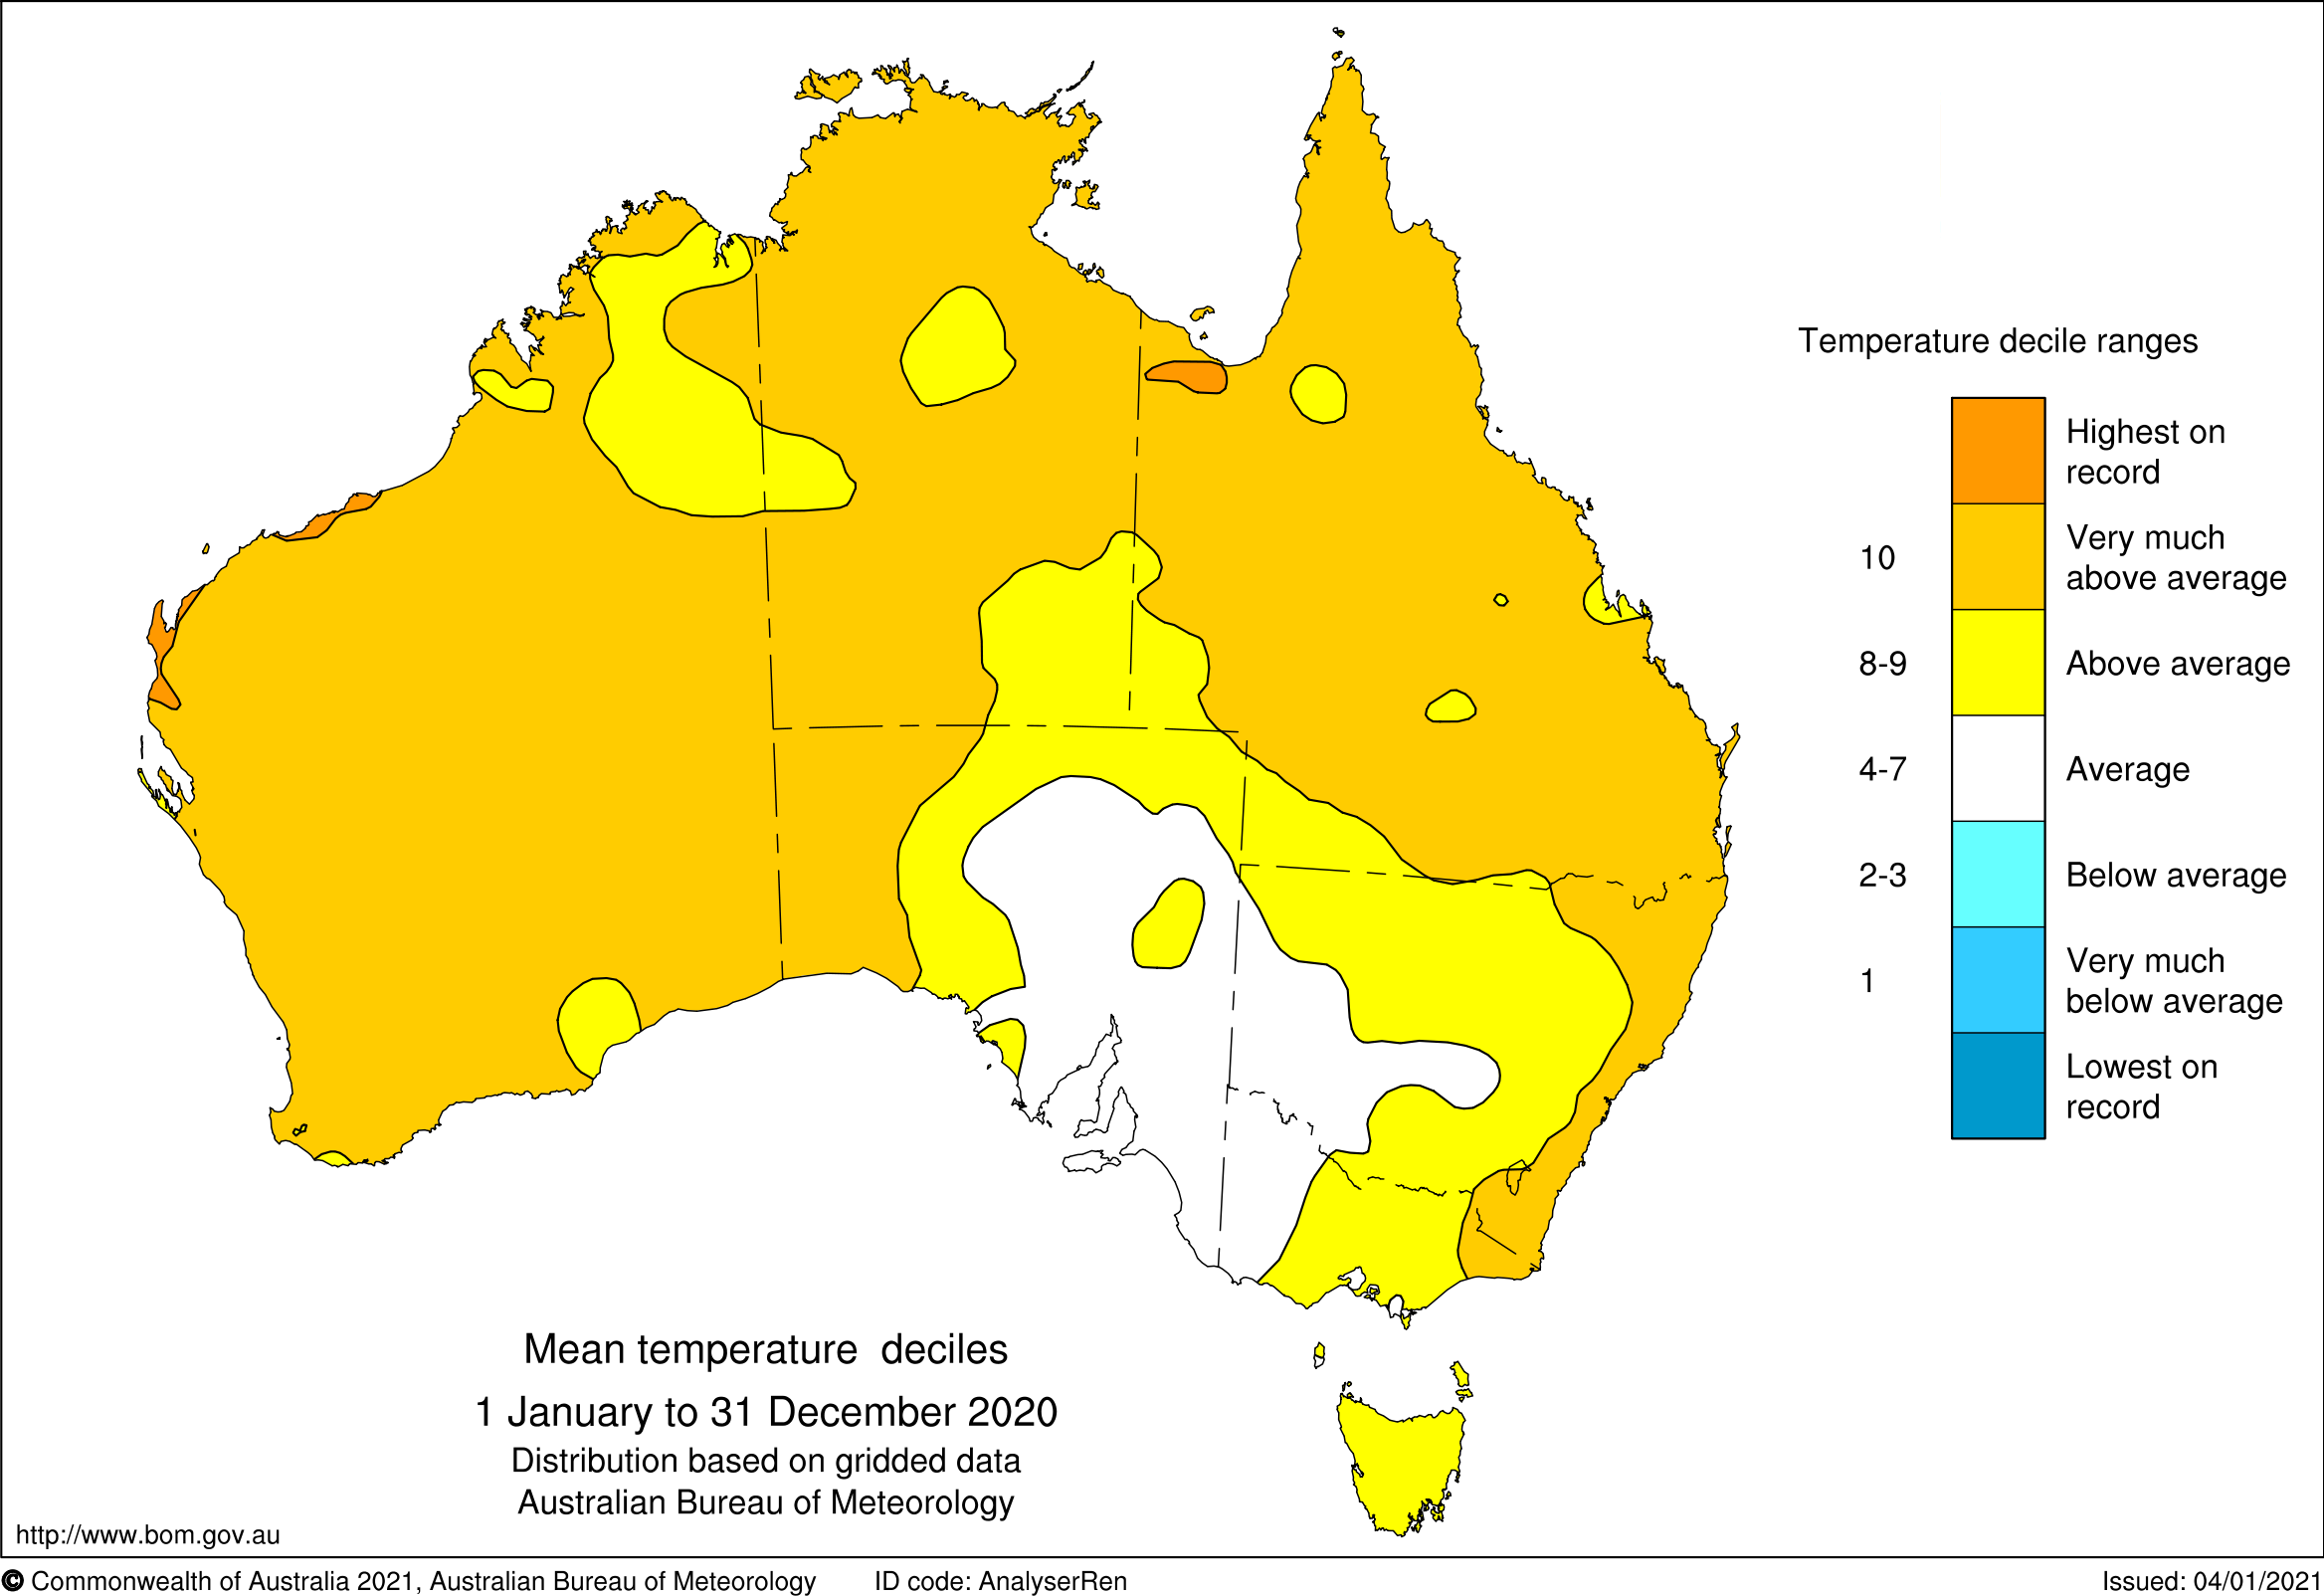
Map: Australia's temperature in 2020.
The warmth was extensive and tenacious. January, February, April, June, August, September, and November were all among the 10 warmest on record for Australian mean temperature for their respective months. We had our warmest November on record, eclipsing the previous November record set in 2014 by 0.40 °C, and rounding out our warmest spring on record.
Mixed rainfall provides some water storage recovery
Rainfall was close to average for the nation as a whole at 483.4 mm; 4% above the 1961–1990 average of 466.0 mm. It was drier than usual over parts of southeast Queensland, western West Australia, and western Tasmania.
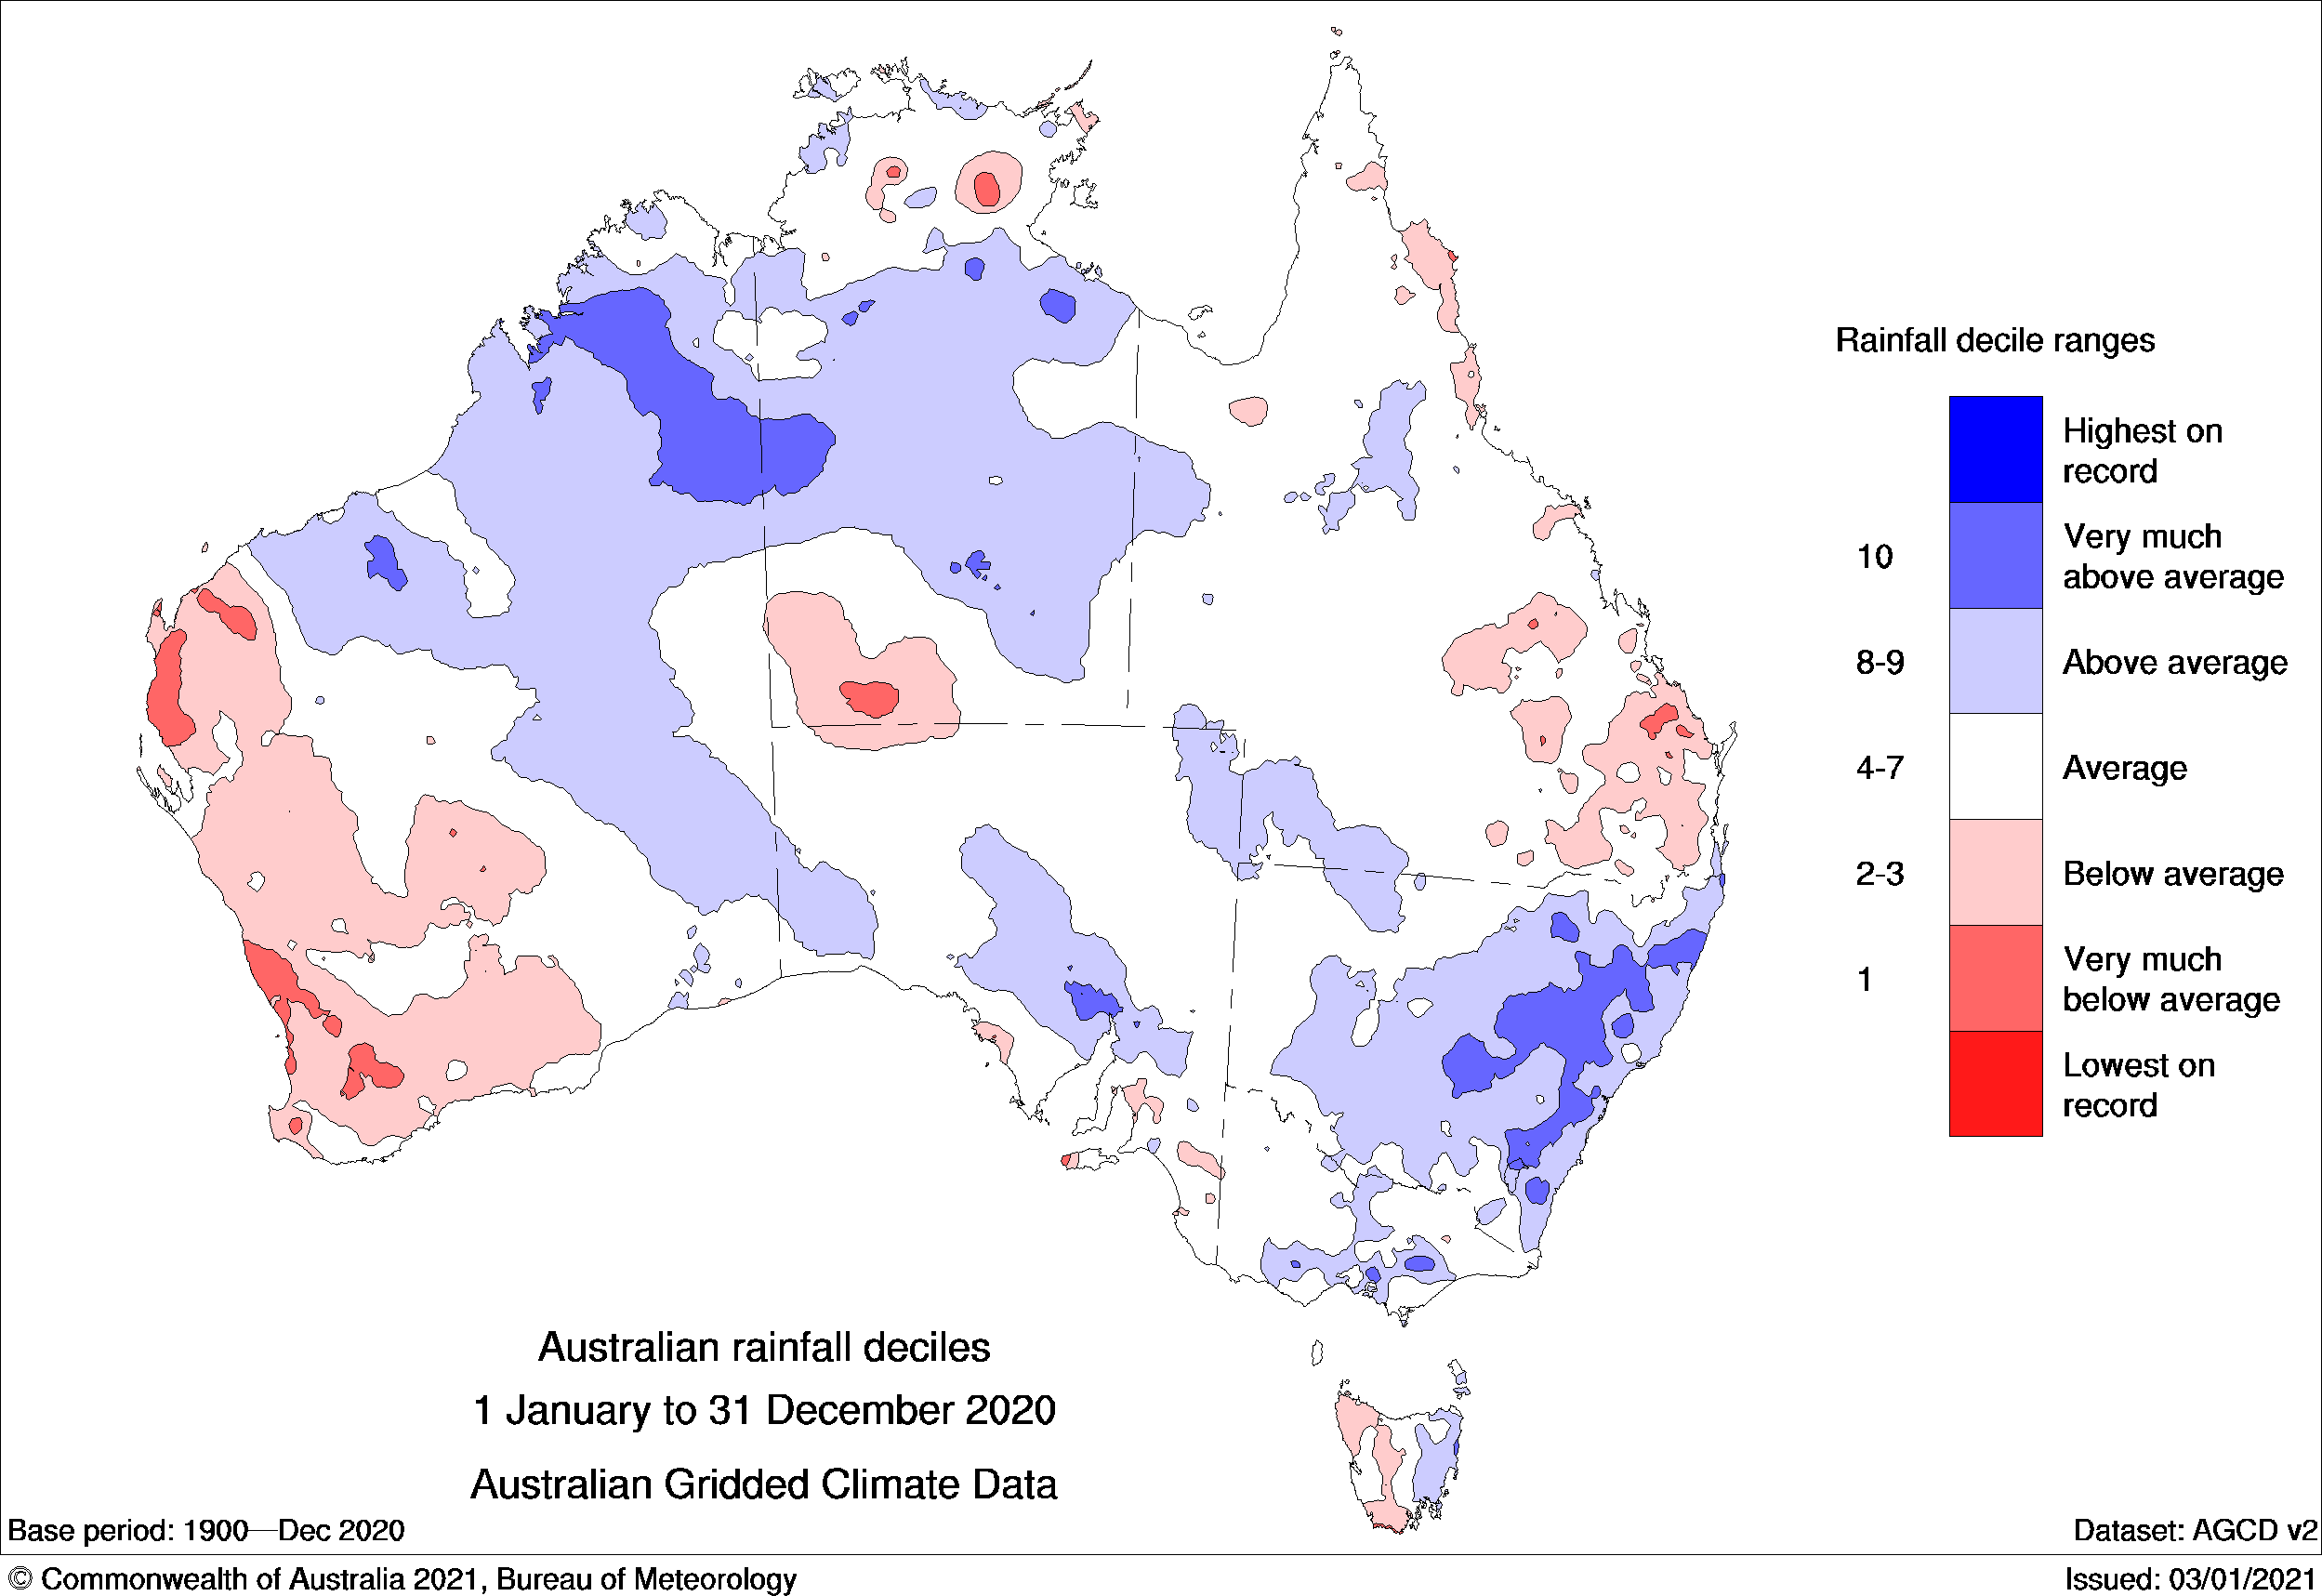
Map: Australia's rainfall in 2020.
Conversely it was wetter than average across large parts of New South Wales, parts of South Australia between the Flinders Ranges and Kati Thanda / Lake Eyre, much of northern and eastern Western Australia and much of the Northern Territory.
Generally wetter conditions from January to April saw levels in many water storages start to recover in eastern Australia. Water storage levels in the southern Murray–Darling Basin increased significantly. The northern Murray–Darling Basin fared less well. Storage levels there remained low at the end of the year. In the north and west of the country storage levels continued to fall in 2020.
Why was it so?
Australia's 2020 rainfall and temperature patterns were consistent with the long-term warming trend and the impact of the natural climate drivers around us.
To our east, the El Niño–Southern Oscillation in the Pacific moved to La Niña by September and reached moderate strength towards the end of the year. This contributed to above-average rainfall over large areas during August, September, October, and December.
To the south, the Southern Annular Mode favoured reduced rainfall over southwest Western Australia, southern Victoria, and Tasmania during May and June. But later in the year it enhanced rainfall across parts of southern Australia at times in August. It also reinforced the wet La Niña signal in early November and for much of December.
To the west, the negative Indian Ocean Dipole-like patterns in the Indian Ocean during late winter to early spring also favoured above-average rainfall over eastern and southern Australia. However, the pattern didn't persist long enough to be declared a negative Indian Ocean Dipole event.
In addition to natural drivers, Australia's climate is increasingly affected by global warming. Natural variability takes place on top of this background trend.
Our annual mean temperature warmed by around 1.44 °C between 1910 and 2019. Most of the warming has happened since 1950.
Average sea surface temperature in the Australian region has warmed by more than 1 °C since 1900. Eight of the 10 warmest years on record have occurred since 2010. The background warming trend can only be explained by human influence on the global climate. The role of climate change is further discussed in State of the Climate 2020.
More information
Subscribe to receive climate information via email.
View climate summaries for each state and territory.

Comment. Tell us what you think of this article.
Share. Tell others.