

Explore our new rain radar and map viewer
27 June 2025
Discover some of the latest map features on our new website.
With more than 3.5 billion page views per year, the Bureau's current website is one of the most visited Australian government websites. We're developing a new website – you can view it here.
Around two thirds of those annual page views are for radar pages or our weather visualisation tool, MetEye. So designing and updating the map experience for our new website was always going to be a priority.
During Tropical Cyclone Alfred in early March 2025, there were 4.9 million visits to MetEye, radar and tropical cyclone pages on bom.gov.au on the same day. was 79% of total visits to the website for that day.
As the population grows and more people reply on our services, we've built a new weather map which is designed to perform at higher traffic levels. We've put a lot of time and effort into the visual presentation and functionality, and the platforms and systems that deliver data.
Powerful new forecast visualisation tool
Two of the most popular features on our current website are radar images and MetEye. On our new website we combine these into one customisable, mobile-friendly weather map. Enter your location to try it out.
Rain radar images
There are 3 main differences with the new website's radar image presentation. You can now:
- see all radar data in one national radar mosaic image
- switch between the radar and other weather map layers within one map viewer
- use the weather map which is now optimised for any device: mobile, tablet or desktop computer.
The map combines data from individual radar stations as one view, known as a 'mosaic' view. If you use our BOM Weather app, you’ll be familiar with this already.
You can view radar coverage across Australia in one seamless map viewer without the need to swap between different radar pages and radius views.
Zooming into specific locations you are interested in is now easier, and you can see the best available data for that area.
The map viewer gives you the option to swap between forecast and past weather for that location under 'More weather'. You can read more about this below.
Since its first release, we have increased the resolution of the new website radar to a 1 km grid, which will help show small but intense rainfalls. The previous version used a 2 km grid.
Improved engine for the new rain radar display
Weather radars don't just take one 360-degree scan of the sky to generate the radar image. They perform multiple scans over 5 minutes at different elevation angles to build multiple observations for each point.
An important part of a radar display is how this data is displayed in a two-dimensional image.
Old versus new radar displays
The previous weather map showed a cross-section of the atmosphere captured by radars at around 1.5 km above the ground. This was historically used due to its simplicity. This altitude is low enough to capture most rain while avoiding interference from tall buildings and mountains.
Instead of a fixed altitude, the display on the new website uses the lowest radar observations available. This makes the radar image a more accurate reflection of what people are experiencing on the ground.
Correcting radar images
Have you ever noticed odd patterns appearing in radar images?
The new display can correct various oddities, called artifacts, that contaminate radar images:
- Clutter – reflections from non-rain targets such as mountains, buildings and vehicles. This typically appears as small regions of reflectivity that do not move when viewed in the animation.
- Interference – disruption from other radio transmitters appears as spikes that extend out from the radar towards the horizon.
- Sea clutter – reflectivity over ocean areas where there is no actual rainfall. It's caused when part of the radar beam is reflected off the ocean surface.
- Insects – large numbers of insects can look like very light, widespread rain, particularly near sunrise and sunset.
- Bright band – an effect that causes the radar signal to look artificially strong at some altitudes. It can happen as the radar beam passes through a layer of melting snow or ice.
While these effects are not always perfectly corrected in the new display, the general quality is vastly improved. The display on our current website doesn't correct for these effects at all.
The degree to which these problems can be corrected also depends on the age and technology of the radar. Some more modern radars have dual-polarisation capability. This gives extra information which helps with correction.
'More weather' lets you choose your own weather adventure
You can find ‘More weather’ as a tab at the top of maps on the new website. It’s where you can choose what you want your map to look like and what weather to display. You can also swap between the forecast and past weather.
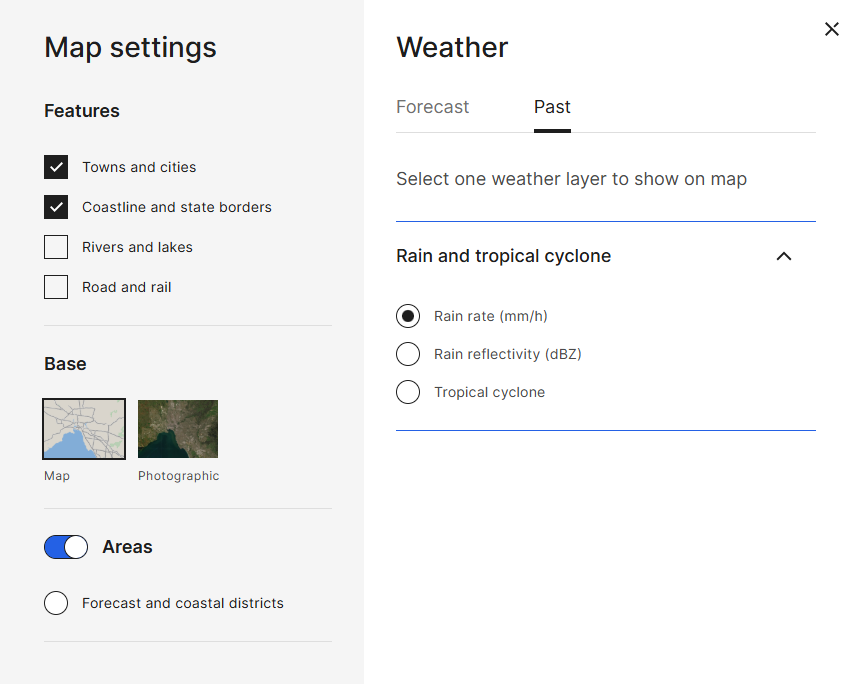
Image: You can select past weather information to view on the map.
For past weather you have the choice to show the radar as either:
- the rain rate in millimetres per hour (mm/h)
- rain reflectivity (or intensity) in decibels of reflectivity (dBZ).
Rain reflectivity indicates the intensity of precipitation. It shows the strength of the radar signal reflected back from the precipitation.
It's strongly dependent on the diameter and number of drops in the cloud, as well as the presence of ice. The sensitivity to ice means that hail may show very strongly even though the corresponding rain rate is low.
You can find out more on how radar-derived rainfall accumulations are calculated.
Choose the forecast you want to see
Switch from the Past tab to the Forecast tab to see the future weather predictions. Forecasts are for the next 7 days (4 days for wave forecast). You can choose what you want to see from options in each of these categories:
- rain
- wind
- waves
- temperature
- humidity and UV
- significant weather.
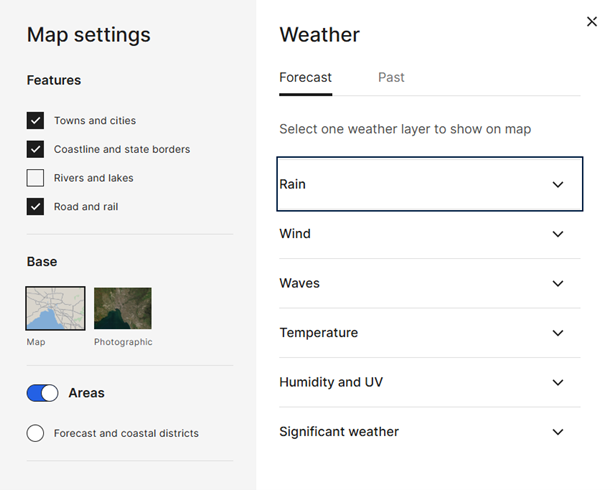
Image: You can select forecast information to view on the map.
Listening to your feedback
Your feedback is important as we continue to build and roll out features on our new website.
These new features address feedback that:
- you like the ability to view the map in full screen and to be able to move around Australia without having to click in and out
- you're looking for more detail in the map and radar feature – including presentation of rainfall.
If you haven't already explored the new rain radar and weather map, find your location and click on the 'more weather' layer icon to see your options.
To provide your feedback on this map, you can:
- respond to the feedback pop-up window
- submit through our Contact page
- use the 'Was this page useful?' button at the bottom of most web pages.
More information
Website help for our new website

Comment. Tell us what you think of this article.
Share. Tell others.