
Annual Climate Statement 2021: wetter and warmer than average
08 February 2022
The Annual Climate Statement for 2021 wraps up a year of weather and climate impacts in Australia.
In the west, Severe Tropical Cyclone Seroja was the southernmost cyclone to make landfall since the 1950s. Eastern Australia saw significant widespread flooding in March and November. Temperatures were warmer than average across the tropics, but it was cooler for parts of the south-east and the interior. Our second year in a row of above-average rainfall was welcome in most parts, following Australia's driest year on record in 2019.
The national rainfall total was 509.7 mm. That's 9% above the 1961–1990 average of 466 mm and makes 2021 the wettest year since 2016. It included our wettest November on record.
Australia's mean temperature for 2021 was 0.56 °C above 1961–1990 average, making it the coolest year since 2012. However, globally, 2021 was one of the 7 warmest years on record. It was the seventh consecutive year where the global temperature was more than 1 °C above pre-industrial levels (1850–1900).
Video: Watch this short video to understand Australia's climate in 2021.
Fires, floods, hail, and heat
A fire that started in the Perth Hills on 1 February was driven by persistent easterly winds. It burnt over 10,000 hectares of land, and damaged or destroyed 98 homes and more than 100 other structures.
Flooding affected several states, including:
- eastern and central Australia during the second half of March
- parts of Victoria during June
- large areas of New South Wales and Queensland from November into December.
Damaging winds associated with a complex low pressure system crossing Victoria brought down trees and tore the roofs from houses on 9 June. The SES received more than 9000 calls for help as over 200,000 people lost power.
There were severe thunderstorms in Queensland during October. They saw giant hail, up to 16 cm in diameter, at Yalboroo (between Mackay and Proserpine) on the 19th. This is the largest recorded hailstone with a verified measurement in Australia.
Severe to extreme heatwave conditions affected:
- the Kimberley and Top End during October
- parts of the north in November and December.
Much warmer than usual across the northern tropics
Mean annual maximum and minimum temperatures were above average for most of northern Australia, Tasmania, and parts of the west coast. But they were below average for parts of inland New South Wales.
2021 was Australia's nineteenth-warmest year on record. Even though it was our coolest year since 2012, temperatures were still much warmer than the historical average. In fact, of all the years on record before the year 2000, only 5 were warmer than 2021.
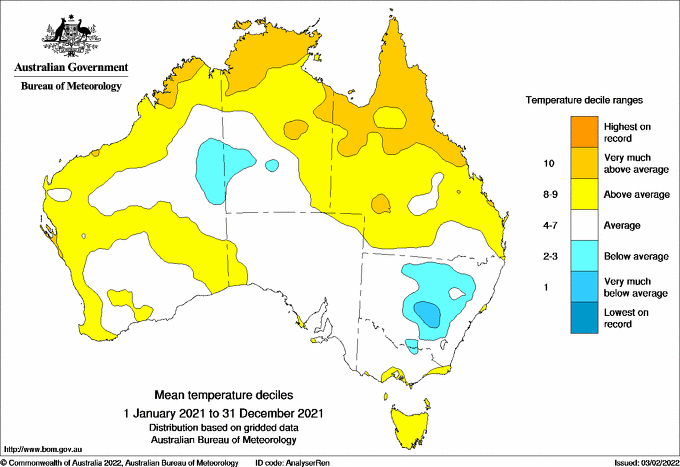
Map: Australia's temperature in 2021.
Wet year clears drought areas and fills dams
Annual rainfall was above average for:
- eastern Victoria
- much of New South Wales
- southern and central west Queensland
- the Gascoyne and South West Land Division in Western Australia
- much of the far northern tropics, including the Top End of the Northern Territory and Cape York Peninsula in Queensland.
One of the few areas that was drier than usual was an area around the border of South Australia and Victoria.
Two years in a row of above-average rainfall meant by the end of 2021 – and for the first time in 5 years – no large parts of the country were in meteorological drought. Major water storages across eastern Australia had significant increases in 2021. The Menindee Lakes in western NSW filled for the first time since 2012.
The most significant exception was in southeast Queensland, where storages remained low.

Map: Australia's rainfall in 2021.
La Niña returns and climate change continues
2021's wetter weather was influenced by several significant climate drivers.
Having emerged in the previous spring, La Niña persisted through summer 2020–21, returning to neutral during March 2021. Signs of La Niña development again emerged in early spring, and it became established in late November. La Niña typically brings above-average rainfall to much of northern and eastern Australia.
Despite there being a La Niña, global temperatures were again higher than average. La Niña usually keeps temperatures cooler than during neutral or El Niño periods. Climate change caused by human activities contributed to the above-average temperatures recorded across most of Australia and the world. Concentrations of all the major long-lived greenhouse gases in the atmosphere rose again in 2021.
A negative Indian Ocean Dipole contributed to above-average rainfall over southern and eastern Australia, and warmth in the tropics between late May and November.
The Southern Annular Mode (SAM) was positive through much of 2021, as often occurs during La Niña. It favoured increased rainfall over eastern Australia during spring to summer. But it decreased the chance of rainfall over western Tasmania through much of the year, and south-west and south-east Australia during winter.
SAM was also strengthened by a stronger than average polar vortex – the winds that circle the south pole high above Antarctica – which also drew weather systems southwards over the Southern Ocean. This contributed to sustained, and at times strong, positive SAM phases early in the year and again in spring.
More information
Subscribe to receive climate information via email.
View climate summaries for each state and territory.

Comment. Tell us what you think of this article.
Share. Tell others.