
Groundwater – making the invisible visible
22 March 2022
Groundwater – more literally, underground water – accounts for approximately 30% of Australia's water use. But because it can't be seen like rivers and lakes, many people don't know about it. So how can we 'see' this important but invisible resource?
Who uses groundwater?
A large proportion of Australia's remote and arid regions rely on groundwater as their sole source of water. It's vital for agriculture, mining, and household needs.
While most urban centres draw on surface water, in the Northern Territory, 90% of water supply comes from beneath the ground. Alice Springs draws all its water from groundwater.
Discover more about groundwater and who uses it.
How to see groundwater
Groundwater is water stored underground. It comes from rain that has seeped into the ground and is captured in the spaces between soil and rocks.
One way of seeing it is through bores. These are holes drilled into the ground to access groundwater. They also provide a window into the hidden groundwater systems. Sediments, rocks, and groundwater intercepted by boreholes are recorded in logs. These logs offer a picture of groundwater storage areas (aquifers) and rock or soil that block the movement of groundwater (aquitards). Bores also provide access points to measure groundwater levels and extract water samples for analysis. This helps us understand the quality and availability of groundwater.
Bores show groundwater conditions at a particular point. But there's also a digital way to see groundwater that provides a fuller picture. The Bureau's Australian Groundwater Explorer captures data from over 900,000 bores. The Groundwater Explorer features a comprehensive groundwater level dataset with 45 million measurements from 235,000 bores. Bore and borehole information, groundwater level, and quality data are updated annually.

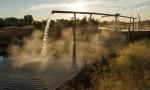
Image: Groundwater sampling at a bore in South Australia. Credit: Geoscience Australia
The Explorer features 3D aquifer visualisations for 12 Australian groundwater systems, including Victoria's Gippsland Basin, the Great Artesian Basin and South Australia's St Vincent Basin. They offer an interactive experience in viewing:
- aquifer and aquitard locations;
- groundwater bores and the aquifers they target
- groundwater management areas.

Image: 3D aquifer visualisation for the Gippsland Basin, Victoria.
How is groundwater information used?
Water managers have the difficult job of balancing competing demands for groundwater between agricultural, industrial, domestic, cultural and environmental needs. To understand how much groundwater is available, how it interacts with surface water features and what the effects might be, managers need as much information as possible about the groundwater system they’re dealing with. Our tools and resources help provide that information.
State governments use groundwater visualisations to support their water management activities. As Steve Barnett, Principal Hydrogeologist explains, the South Australian Department of Environment and Water draws on the information when providing scientific advice for communities.
'The 3D visualisations help the department provide evidence-based information to the community. They're a valuable input to groundwater management planning.
'In some aquifers, groundwater levels have been gradually declining over the last 15 years because of a long period of below-average rainfall. The 3D visualisation helps to put the declines into perspective. It allows them to be seen in the context of the overall storage capacity. People can understand whether the decline is large, or relatively small, considering the size of the aquifer.
'The visualisations help keep the community informed and contribute to decisions for the best management approach for them.'
More information
Take a look at our groundwater tools that uncover this hidden resource.
Explore groundwater systems using your own web mapping tools by heading to the Australian Water Data Service. Connect to spatial data, maps and the APIs that underpin the our groundwater products.
Seeing the water under our feet: groundwater in 3D
Mapping groundwater-dependent ecosystems

Comment. Tell us what you think of this article.
Share. Tell others.