Bureau of Meteorology Media Statement No. 2: Climate Records
05/09/2014
Numerous media stories have questioned the methods used by the Bureau in regard to Australia's climate record.
Adjusting temperature data, a process known as homogenisation, is carried out by meteorological authorities around the world as best practice, to ensure that climate data is consistent through time.
As our data preparation reports explain, a key requirement for compiling and then analysing a long-term record of daily maximum and minimum temperatures for any given site is assuring that the temperature records are not artificially biased by effects that are not climate-related, such as:
- A shift in the location of the station (for example, from a post office to an airport);
- A change in the environment around the station (for example a tree grows, a structure is built, a lawn is irrigated); and
- A change in measurement method (for example, from a manual instrument to a recording electronic instrument).
Comparison between adjusted and unadjusted temperatures
Both adjusted and unadjusted temperatures show that Australia's climate has warmed. Since 1955 adjusted and unadjusted data are virtually identical. It is during this time that most of the warming has occurred in Australia.
The graph below shows temperature trends since 1910 from the unadjusted temperatures (AWAP), together with those that have been carefully curated, quality controlled and corrected for artificially induced biases (ACORN-SAT). Carefully curating and correcting records is global best practice for analysing temperature data.
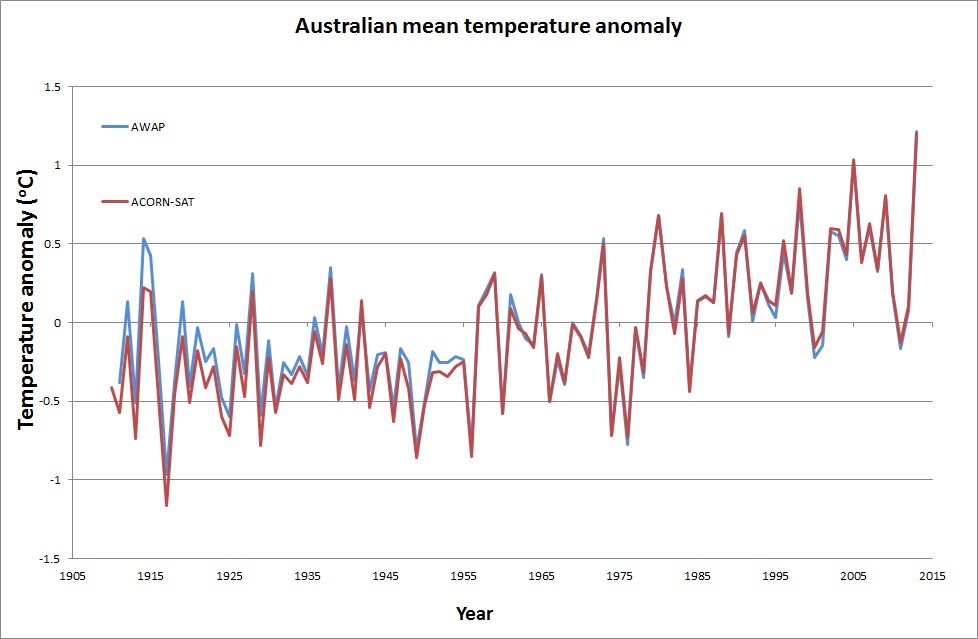
Figure 1: Comparison of two different Bureau of Meteorology temperature trends for Australia. The Blue line is the unadjusted (AWAP) Australian average temperature. The red line is the homogenised (ACORN-SAT) temperature for Australia.
Comparison between land and sea temperatures
Warming in the Australian region is also evident in local sea-surface temperatures. Sea-surface temperatures are monitored and analysed in very different ways to temperatures over land.
Observations of warming in the oceans around Australia show trends very similar to those for the Australian continent itself.
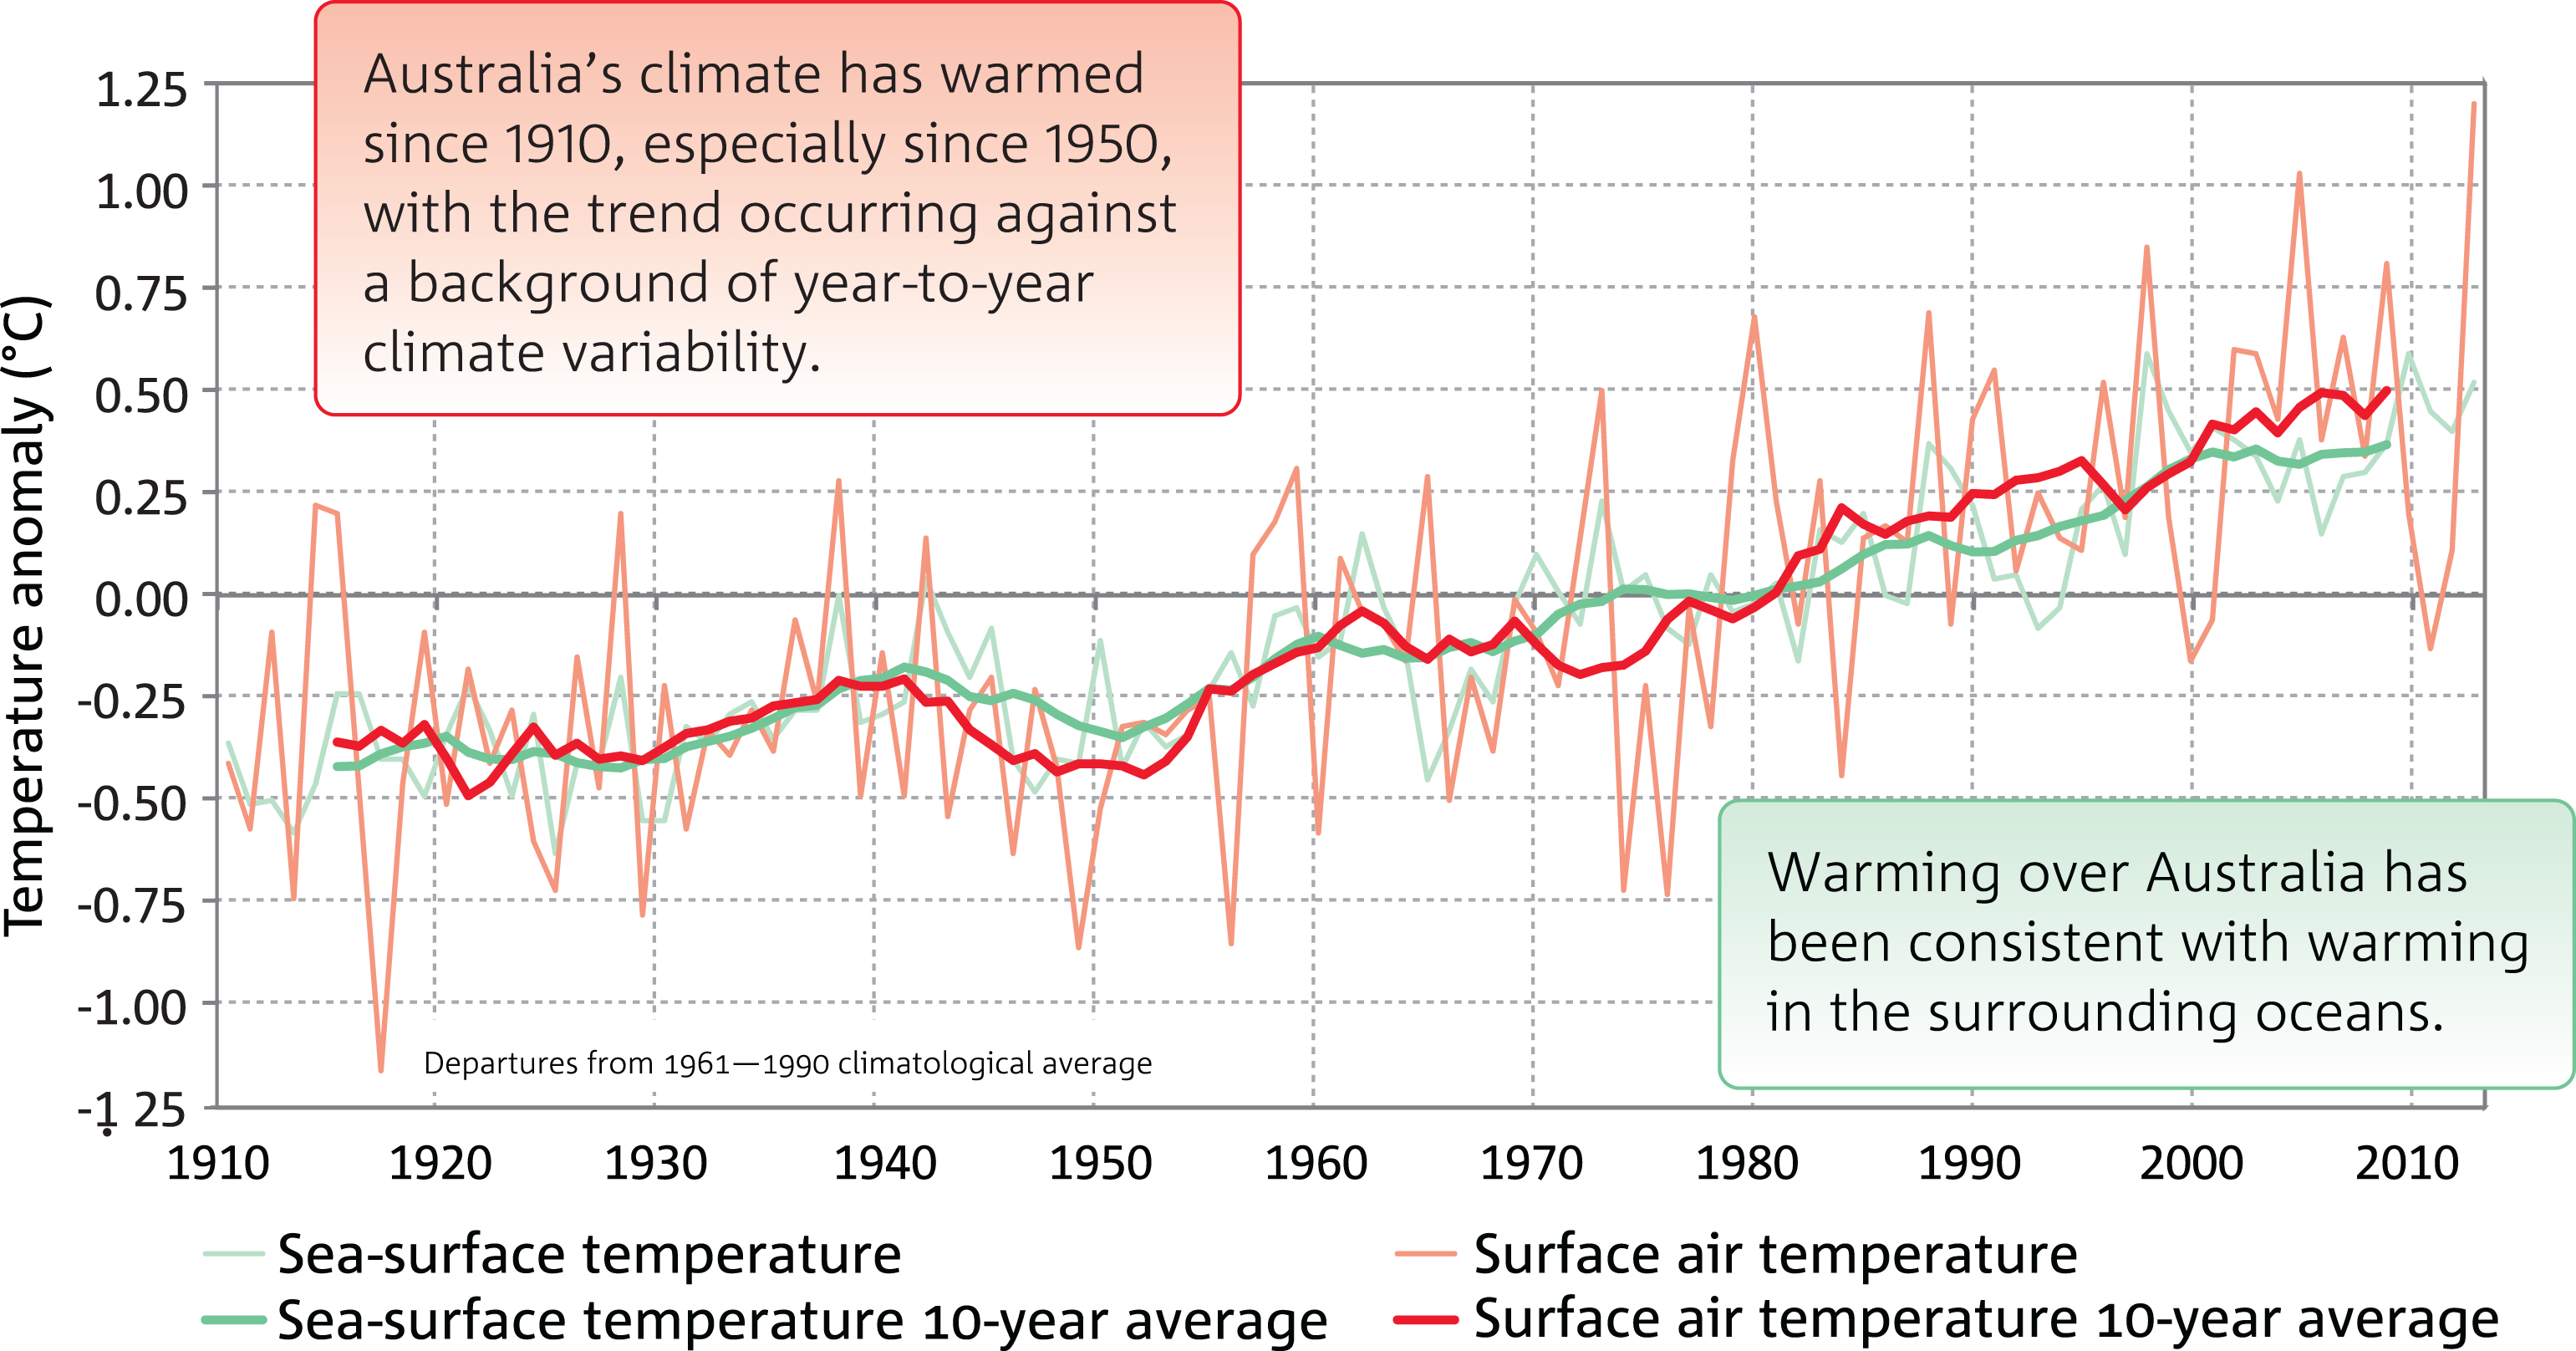
Figure 2: Time series of anomalies in sea-surface temperature and temperature over land in the Australian region. Anomalies are the departures from the 1961-1990 average climatological period. Sea-surface temperature values are provided for a region around Australia (from 4°S to 46°S and from 94°E to 174°E).
Comparison with international climate data
The warming trend across Australia is also evident in at least 18 different methods of preparing and analysing the temperature data.
The graph below represents Australian temperatures from multiple authoritative sources, including overseas agencies who prepare their own estimates of temperature changes over Australia. These data include a mix of homogenisation techniques, unadjusted data and satellite data.
A comparison of 18 different estimates of Australian annual average temperatures for 1911 to 2013 shows the same overall warming trend. The data come from the Bureau of Meteorology (ACORN-SAT homogenised, AWAP raw), satellites ("Sat"), and 15 international datasets.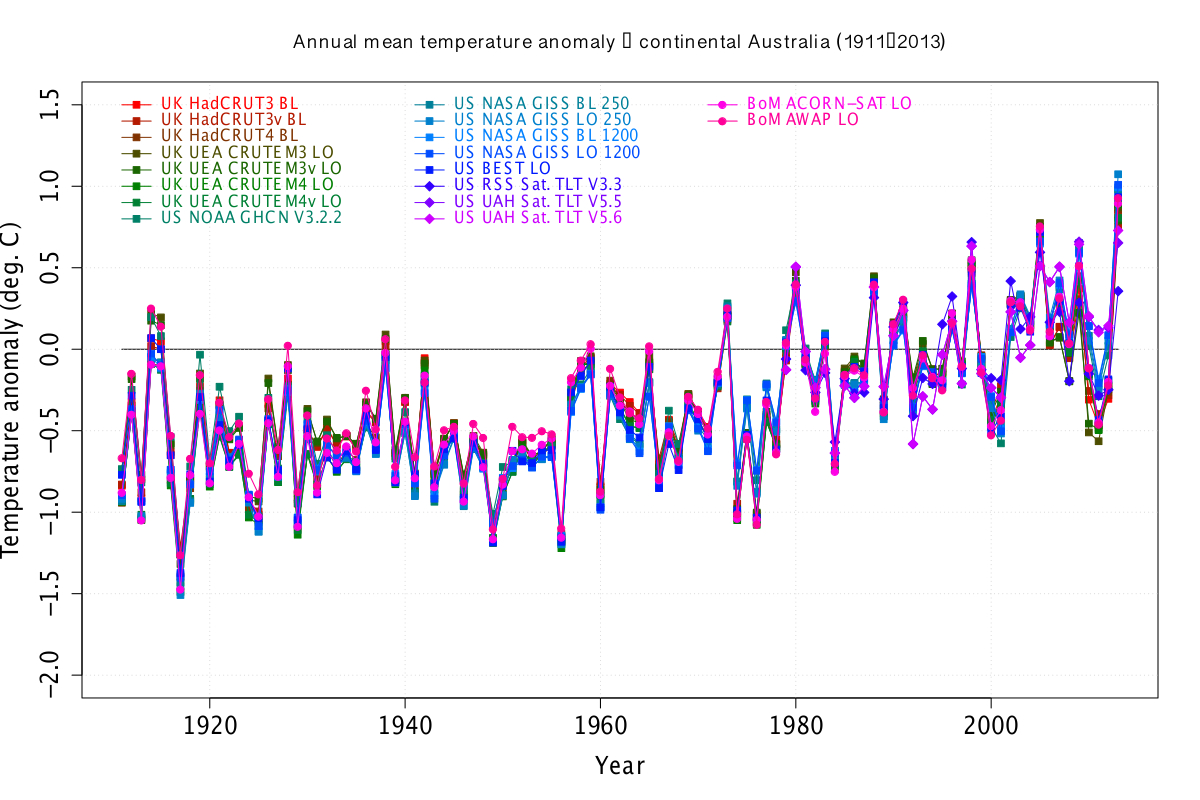 Figure 3: Comparison of 18 different Australian and international temperature datasets for Australia.
Notes on Figure 3: Annual mean temperature anomaly for continental Australia (1911-2013) - a comparison of local and international datasets, comprising "land only" (LO) surface air temperature (SAT) datasets, blended land-ocean datasets (BL) and satellite lower tropospheric datasets (TLT). Datasets from the Bureau of Meteorology (BoM) include the operational whole-network (unhomogenised) dataset (AWAP) and the Australian Climate Observations Reference Network-Surface Air Temperature (ACORN-SAT) dataset. Datasets from the United Kingdom (UK) are obtained from the University of East Anglia's Climatic Research Unit. Their LO datasets are merged with the UK Met Office Hadley Centre's sea-surface temperature (SST) analyses to create the HadCRU BL datasets. Dataset versions 3 and 4 are shown, with (v) and without variance adjustment. Datasets from the United States (US) National Aeronautics and Space Administration (NASA) Goddard Institute for Space Studies (GISS) are available in two analysis scales (250 km and 1200 km), courtesy of the US National Oceanic and Atmospheric Administration (NOAA) Earth System Research Laboratory's (ESRL) Physical Sciences Division (PSD). The Global Historical Climatology Network (GHCN) version 3.2.2 dataset was obtained from the NOAA National Climatic Data Center (NCDC). The Berkeley Earth Surface Temperature (BEST) dataset was obtained from Berkeley Earth, at Berkeley University in the US. The TLT datasets (1979-2013 only) were obtained from the University of Alabama in Huntsville's (UAH) National Space Science and Technology Centre (NSSTC) and Remote Sensing Systems (RSS).