Bureau of Meteorology Media Statement No. 1: Climate Records
27/08/2014
Contrary to assertions in some parts of the media, the Bureau is not altering climate records to exaggerate estimates of global warming.
Our role is to make meteorological measurements, and to curate, analyse and communicate the data for use in decision making and to support public understanding.
To undertake these tasks, the Bureau employs highly skilled technicians and scientists and invests in high quality monitoring equipment.
The Bureau measures temperature at nearly 800 sites across Australia, chiefly for the purpose of weather forecasting. The Australian Climate Observations Reference Network - Surface Air Temperature (ACORN-SAT) is a subset of this network comprising 112 locations that are used for climate analysis. The ACORN-SAT stations have been chosen to maximise both length of record and network coverage across the continent. For several years, all of this data has been made publicly available on the Bureau's web site.
Temperature records are influenced by a range of factors such as changes to site surrounds (for example, trees casting shade or influencing wind), measurement methods and the relocation of stations (for example, from a coastal to more inland location). Such changes introduce biases into the climate record that need to be adjusted for prior to analysis.
Adjusting for these biases, a process known as homogenisation, is carried out by meteorological authorities around the world as best practice, to ensure that climate data is consistent through time.
At the Bureau's request, our climate data management practices were subject to a rigorous independent peer-review in 2012. A panel of international experts found the Bureau's data and methods were amongst the best in the world.
The Bureau's submissions to the review were published on the Bureau's website, as were the findings of the review panel.
The Bureau's methods have also been published in peer-reviewed scientific journals.
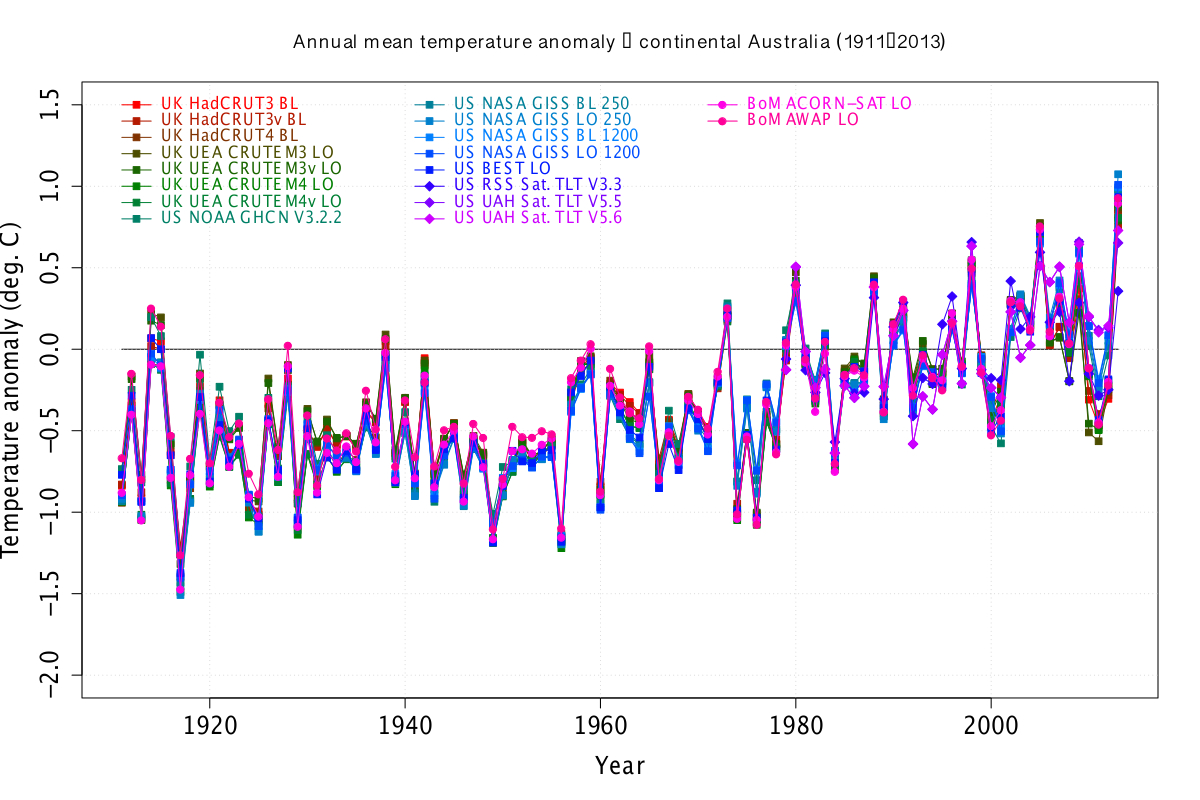
Both the raw and adjusted ACORN-SAT data and the larger unadjusted national data set all indicate that Australian air temperatures have warmed over the last century. This finding is consistent with observed warming in the oceans surrounding Australia. These findings are also consistent with those of other leading international meteorological authorities, such as NOAA and NASA in the United States and the UK MetOffice. The high degree of similarity is demonstrated below in Figure 1.
The Bureau strives to ensure that its data sets and analysis methods are as robust as possible. For this reason we place considerable emphasis on quality assurance, transparency and communication. The Bureau welcomes critical analysis of the Australian climate record by others through rigorous scientific peer review processes.
Go to the ACORN-SAT page for further information.
Annual mean-temperature anomaly

Figure 1: Comparison of the time series (1911-2010) using analysis grid sets from 18 different sources, including from adjusted and unadjusted data and from analyses from international authorities. All anomaly values in degrees C, calculated as a difference between the annual values and the respective with respect to 1981-2010 means. Satellite time series of the lower atmosphere are plotted for 1979-2010. Source: CAWCR Technical Report No. 050, Page 21, Figure 11.


